 The AFFL Scoring Rules were originally designed around the AF Arena Scoring Package with a few modifications based on the two seasons of data from the test league, but plans have always been - and were written into the rules - for a full scoring rule audit after the first official AFFL season. Because of the league size, the specialized roster and format, and because of the AFFL's hosting site's custom scoring options, a one-size-fits-all scoring package is a less than optimum scoring solution for the league. After the inaugural 2019 season of the AFFL, several shortcomings of the scoring rules in place were noted. Including:
-
- Quarterback Scoring was overvalued, particularly on the extreme top end of per/game scoring. In the mid and low ranges, QB scoring was overly erratic, and on the low end produced too many extreme negative per game scores. Additional to the scoring anomallies, this also prevented the roster set-up from being utilized to it's design (see Roster Note below).
- Runningback Scoring on the extreme top end of per/game scoring was also far too high. Additionally, the midrange of runningback scoring was too thick, overvalueing low and low-mid range runningbacks.
- Wide Receiver (and Tight End) Scoring was undervalued across the board from low to high end players.
- Kicker Scoring values were too low, overall, and did not make enough of a distinction between top and low end options.
- Kick Returner Scoring lacked both consistency and impact to overall scoring.
- Defensive Scoring (IDP) did not achieve desired parity with ofensive scoring.
On average, per game scoring often broke down to ranges similar to the following:
-
- Offensive scoring totals were 40%-70% of per game totals
- Defensive scoring totals were 20%-50% of per game scoring totals
- Special Teams scoring totals were often ,5% of per game scoring totals
Optimally, for the AFFL format, the per game scoring ranges should look more like this:
-
- Offensive Scoring = 40% (+/- 10%) of total per/game averages
- Defensive Scoring = 40% (+/- 10%) of total per/game averages
- Special Teams Scoring = 15%-20% of total per/game averages
ROSTER NOTE: Some of the scoring problems will be alleviated by planned changes to the roster settings - including offensive position limit adjustments, and/or an additional defensive starter. Those options, and others are being reviewed in conjunction with the scoring edit; however, as of this revision, the plan is to change offensive starting lineup settings to 1 superflex (QB/RB/WR/TE) and 4 flex (RB/WR/TE) positions to give teams greater flexibility in building rosters, create divergent team management strategies, and generate more overall parity among a field of 20 teams.
Also of note is that the 2019 QB Scoring shortcomings prevented the QB/RB/WR/TE starting position from being utilized as designed - by design, the superflex position is not intended to be strictly a QB position in the AFFL but rather a starting spot for an individual team's best offensive player (regardless of position). In 2019, however, QB scoring was such that even mid-lower tier QB's were more valuable than a lot of upper tier players at the other skills positions, forcing teams to opt for starting a QB there even if only poor options for QB were available. The 2020 Scoring Revisions will hopefully address that as well.
Offensive Scoring Revisions
Note: 2019 Scoring Rules were broken down by category (Passing, Rushing, Receiving), but 2020 Scoring Revisions break scoring down by positition with different Passing, Rushing, Receiving score values based on position of individual player
Fumbles
Fumbles rules have been revised accross the board on offense, helping to limit the negative impact of players having particularly bad outings

Quarterback Scoring
Below is a side by side comparison of 2019 and 2020 Scoring Rules for the Quarterback position. Notes on the changes are below that, followed by multiple comparison charts.
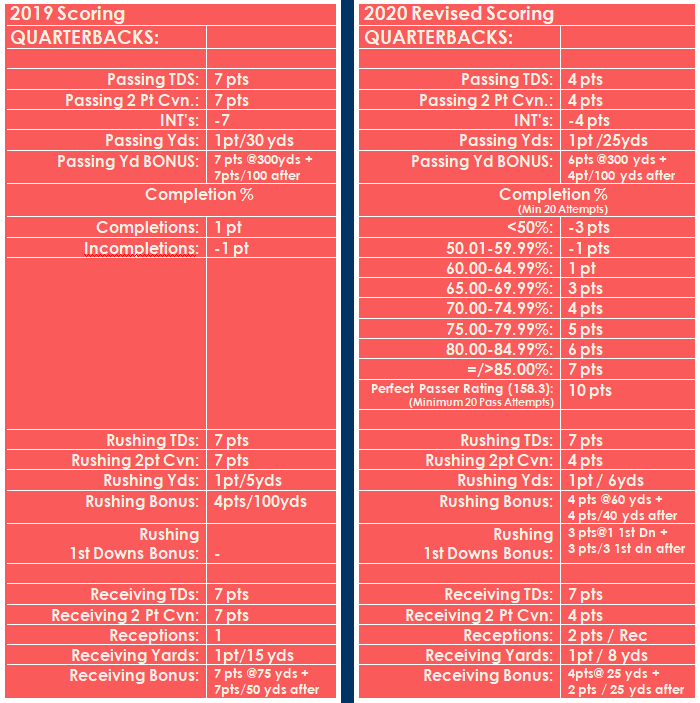
QB NOTES:
- Problems with 2019 QB scoring included:
- Too much overall positional value - even lower tier QBs were scoring on par with upper tier players at other positions
- The top 20 or so individual QB game scores were off the charts too high
- Bottom end per game scores were far too low into negatives
- Per game scores in the low-middle, middle, and high-middle ranges were all over-valued when compared to their stat lines
- Week to week consistency was an issue
Solutions:
- Lowering passing TDs from 7 to 4 points and shaving a little off the passing yardage bonus did just about all that was needed to bring overall scoring down to a reasonable level, in particular it kept mediocre QBs from scoring top end points (while keeping rushing TDs at 7 points gave rushing QBs just an appropriate amount of an edge)
- Dropping interceptions from -7 to -4 , combined with the fumble scoring changes (see above) eliminated a lot of the deep negatives in per game scoring when quarterbacks just had a really bad day (under old scoring, could very quickly fall into double digit negatives
- A lot of the game to game inconsitency was cleaned up with lowering the negative values
- Addressing completions/incompletions was the magic bullet
- The 2019 system of +1/completion and -1/incompletion simply didn't work
- It produced too many extreme scoring outcomes - on the low side if a QB had a really bad day, and on the high end if a QB just threw the ball a ton; it also produced some unreasonable results for performances that were mediocre, but had lots of completions
- The new scaled completion percentage scoring leveled off some of the high end scoring, raised some of the low end scoring, created better week to week consistency, and created much more realistic scoring when compared to matching stat lines; it also allowed QBs having a really great day to stretch their scoring out ahead of those having just an above average day, without letting it get entirely out of hand
EXAMPLES:
Below are multiple comparison charts, click on any of them to get an enlarged view; (NOTE: all references to "2020 Scoring" are 2019 stats with 2020 Rules applied to them)
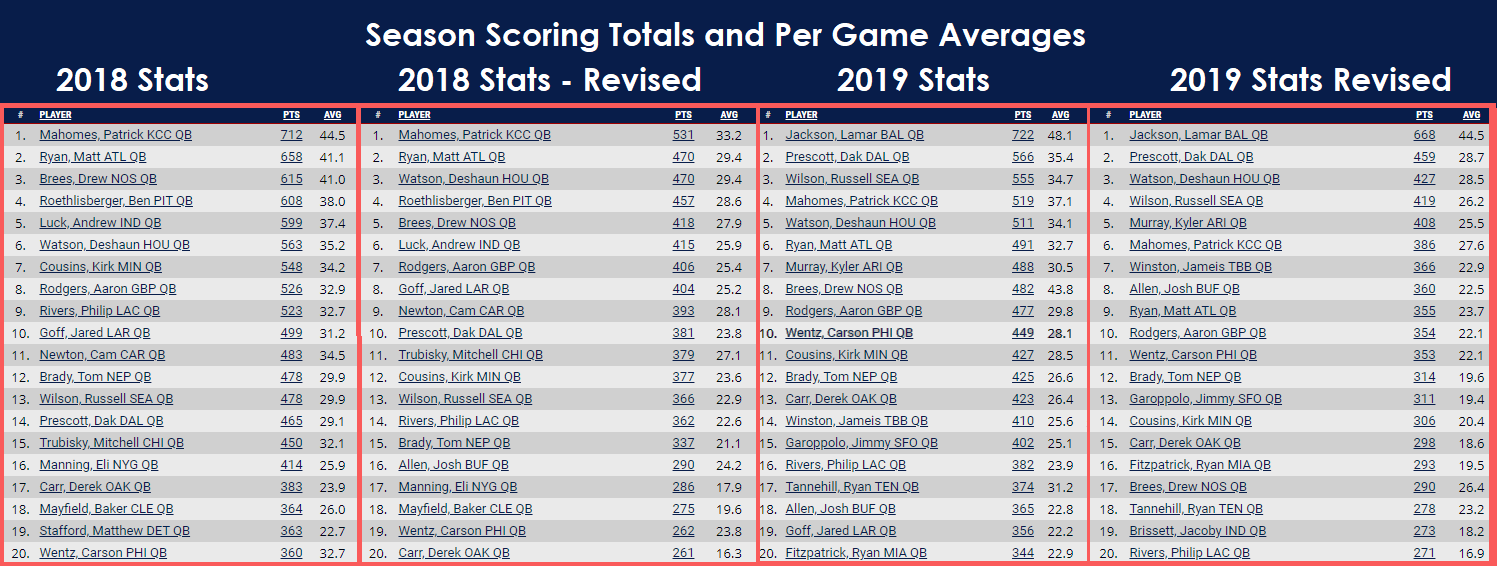
- Fig. 1.1 shows a side by side comparison of the Season Scoring Totals and Per Game Averages of the top 20 QBs from 2018 and 2019 under original and revised scoring rules
- Notice season totals under the revised rules run appx 50-150 points lower (per game averages run appx 5-10 points lower); of particular note is the more prominent difference between the scoring of the top and bottom halves of the list - this is intentional
- Notice also the relative consistancy of per game average for like rankings in both 2018 and 2019 under the Revised scoring rules
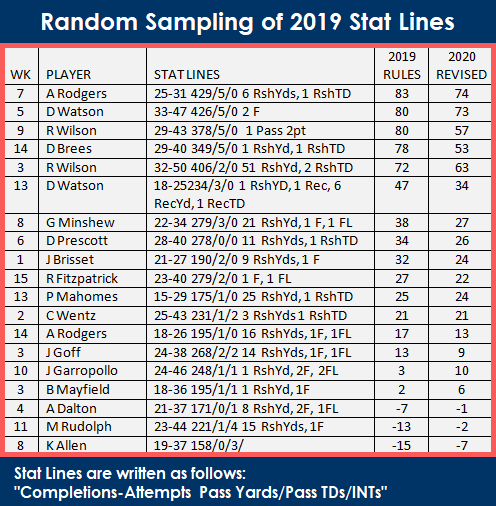
- Fig. 1.2 shows a random sampling of 20 actual 2019 stat lines with a comparison of their 2019 scores and what their scores would be under 2020 scoring revisions
- NOTE: Rodgers' Wk 7 (74 points) and Watson Wk 5 (73 points) both include a 10 point bonus for a Perfect Passer Rating; Perfect Passer Ratings are rare events - 5 times in 2019, 3 times in 2018, 0 times in either 2017 or 2016 - so these two particular examples throw the comparison off a bit
- Note how the top 5 examples are still very fantasy high scores reflective of phenomennol QB performances, but have dropped a little into a slightly more realistic individual fantasy scoring range
- Note how the bottom 3 scores are less negatively impacted by a very bad performance, while still being reflective of a very bad performance
- The examples in the mid range should show 2020 scoring values more closely representing the value of the stat lines when compared to each other vs the 2019 scores
- Brisset Wk 1, Fitzpatrick Wk 15, and Mahomes Wk 13 offer a particularly good example of similar stat lines showing a wide variance under 2019 scoring, and a closer, comperable score under 2020 rules
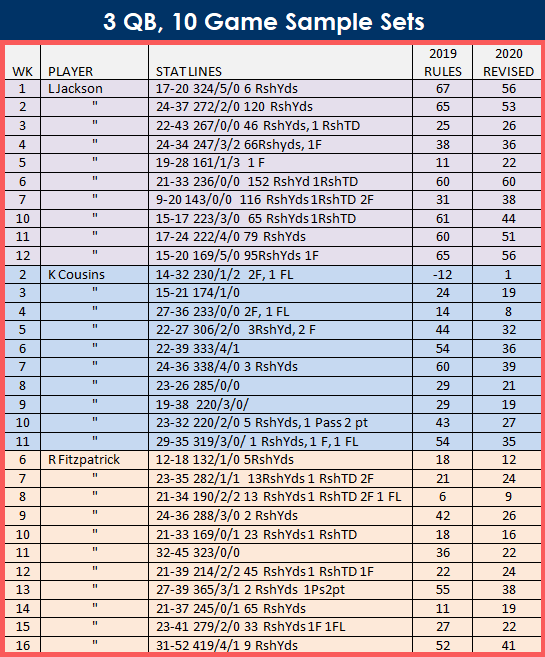
- Fig. 1.3 shows a ten game sample set of 3 different QBs; Jackson ranked #1 in total QB Scoring under both 2019 and 2020 scoring, Cousins ranked #11 under 2019 rules and #14 under 2020 Scoring, and Fitzpatrick ranked #20 under 2019 scoring and #16 under 2020 scoring
- Note: Jackson remains the #1 scoring QB under the revised rules, but his super high scoring games are toned down just a little
- Cousins' scores under 2020 rules more closely match his stat lines; Wks 2, 3, 5, 8, 9, and 10 are excellent examples of this
- Fitzpatrick's Rushing TDs allowed him to move up from #20 to #16
Running Back Scoring
Below is a side by side comparison of 2019 and 2020 Scoring Rules for the Runningback position. Notes on the changes are below that, followed by multiple comparison charts
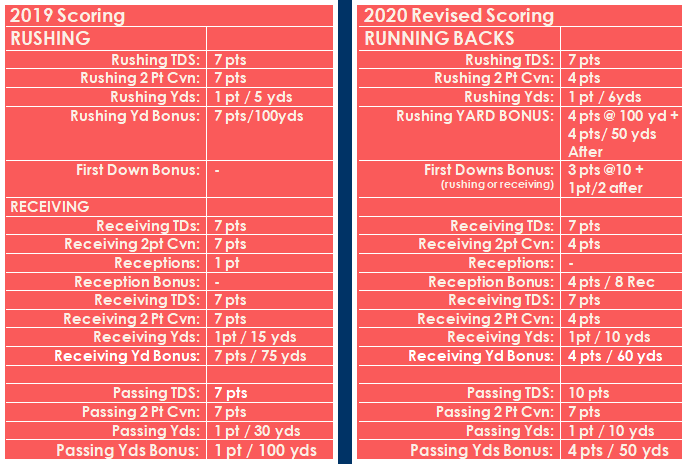
RB NOTES:
- Like QB scoring, RB scoring was greatly overvalued under 2019 scoring rules
- Unlike QB scoring, RB scoring did not suffer from week to week consistency issues, nor did the bottom end have negative scoring issues
- A bigger problem than the extreme high end per game scores, though, was a general over valueing of mid and low range per game scoring to the extent that mediocre RBs were often more valuable than higher tier WRs and TEs
- Like QB scoring, the general over valueing of RB scores led to fantasy scores that were too high when compared to equivelant type stat lines (in other words, average performances were often scoring in the 30-40+ point range
- Also like QB scoring, the 2019 soring system alowed too many lower tier RBs to be positive week to week starters beyond their real-world value
Solutions:
- A slight change to yardage scoring and yardage bonus lowered overall scoring slightly (see chart), with a greater impact to the midrange than to the high range
- Under 2019 scoring a 100 yard performance netted 27 points; a 150 yd performance netted 37 points; and a 200 yard performance netted 54 points - while under 2020 scoring revisions, a 100 yard performance nets only 20 points; 150 yards nets 29; and 200 yards nets 41 points
- Removing PPR scoring from RBs took away nickel and dime scoring from mid range RBs, while adding a reception bonus of 4pts/ 8 receptions (and increasing the receiving yardage and yardage bonuses) allowed PPR RB studs to still separate themselves from average backs and produce high enough scores to keep pace with workhorse backs
- Adding a bonus for 10 first downs (rushing or receiving) allowed for even more separation between the per game scoring of average RBs and high tier RBs
- The 10 points/passing TD is a bonus thrown in for the occasional exciting trick play
EXAMPLES:
Below are multiple comparison charts, click on any of them to get an enlarged view; (NOTE: all references to "2020 Scoring" are 2019 stats with 2020 Rules applied to them)
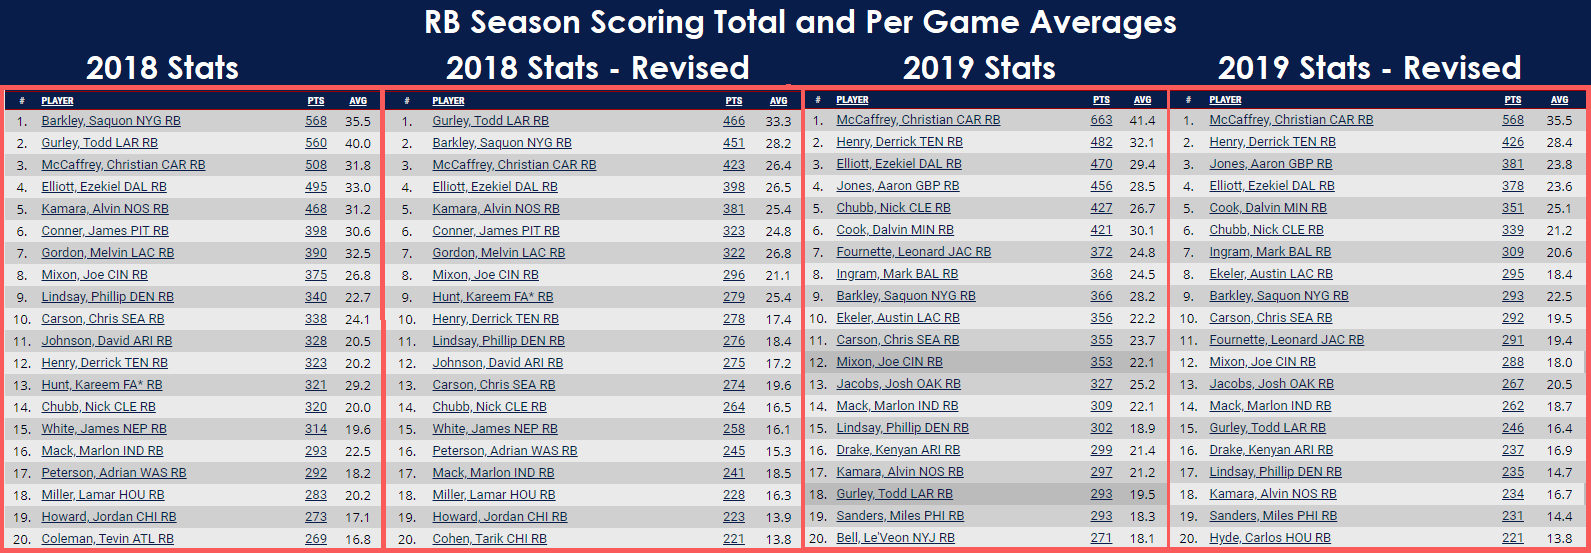
- Fig. 2.1 shows a side by side comparison of the Season Scoring Totals and Per Game Averages of the top 20 RBs from 2018 and 2019 with the top 20 under revised scoring for both seasons
- Note a scoring drop of 50 - 100 points (season) and about 5 points/game, consistently in both seasons
- Also, as with QBs, theres a more significant drop between the top and bottom of the top 20 than with 2019 scoring rule
- Also note the relative consistency of scoring between like ranks in both season under revised rules
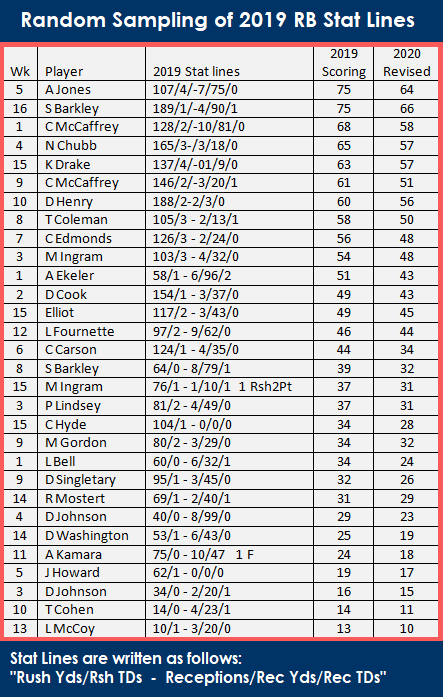
- Fig 2.2 shows a random sampling of 30 actual 2019 stat lines with a comparison of their 2019 scores and what their scores would be under 2020 scoring revisions
- Of note, the greater flattening of scores at the top and mid range as compared to bottom range performances
- Also of note, scores remain beefy in the midrange, meaning RB scoring drops into a more realistic range, but retains the importance of the position even for mid tier RBs whil;e still not over-valueing those mid-range RBs
- Of particular note, even with the removal of 1 point per reception, pass heavy stat lines can still compete with workhorse stat lines; comparing Ekeler Wk1 and Cook wk 2 is a great example of that
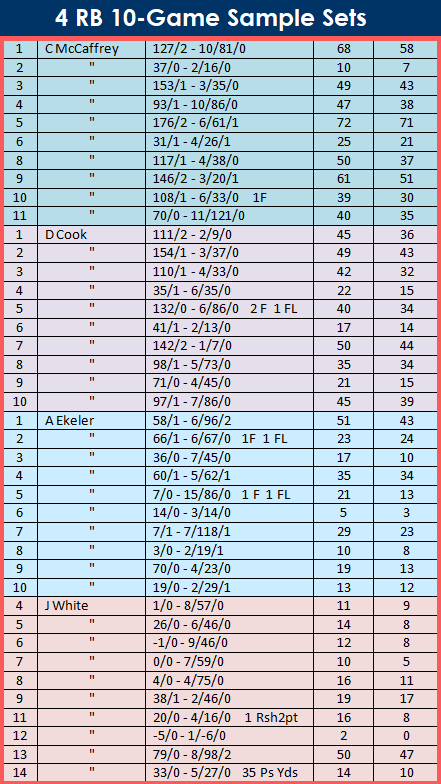
- Fig 2.3 Shows 10 game sample sets of 4 different RBs: McCaffrey remains #1 under both sets of scoring rules; Cook was ranked #6 under 2019 scoring rules, #5 under revised rules; Ekeler was #10 and #8; and White remains ranked #30 in both
- What stands out most is an overall more realistic spread of scoring, and also that reception heavy statlines actually get a slight boost (despite eliminating the 1 PPR) which is realistic considering that dual threat backs present a slight advantage for their teams in the real world as well....yet the advantage isn't huge, again, just like in the real world
Wide Receiver Scoring
Below is a side by side comparison of 2019 and 2020 Scoring Rules for the Wide Receiver position. Notes on the changes are below that, followed by multiple comparison charts
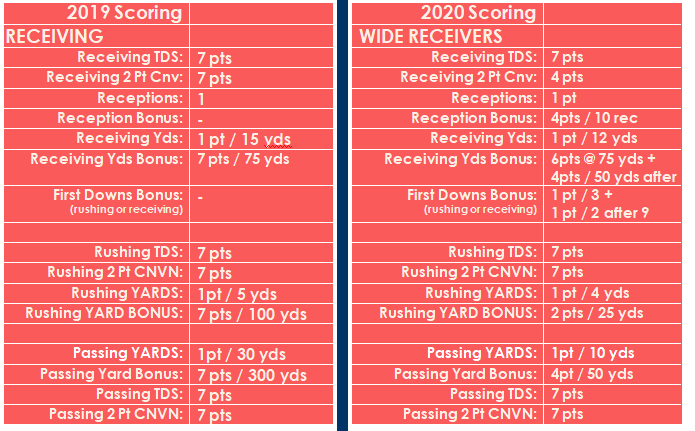
WR NOTES:
- opposite to the shortcomings of the 2019 scoring rules of QB and RB, Wide Receiver scoring was undervalued
- Because of the depth of NFL starters at the position (64+ starting WRs vs 32 starters for QB and RB) undervalue was most notable at the very top and very bottom tiers of week to week starters - in other words, the top WR studs were not scoring nearly as high top-of-their-position players, while low range stat lines were barely scoring at all
SOLUTIONS:
- Depreciating the scoring at the QB and RB positions did a lot to bring WR scoring up in parity even before WR scoring was revised
- Adding a reception bonus on top of the 1 point per reception (3 points for 10 receptions + 1 point per additional 2 receptions) gave top tier WR stat lines and added boost
- Restructuring the yardage scoring and yardage bonuses gave gave an additional boost to both the high and low end of receiver scoring, as did the new scoring rules for first downs
EXAMPLES:
Below are multiple comparison charts, click on any of them to get an enlarged view; (NOTE: all references to "2020 Scoring" are 2019 stats with 2020 Rules applied to them)
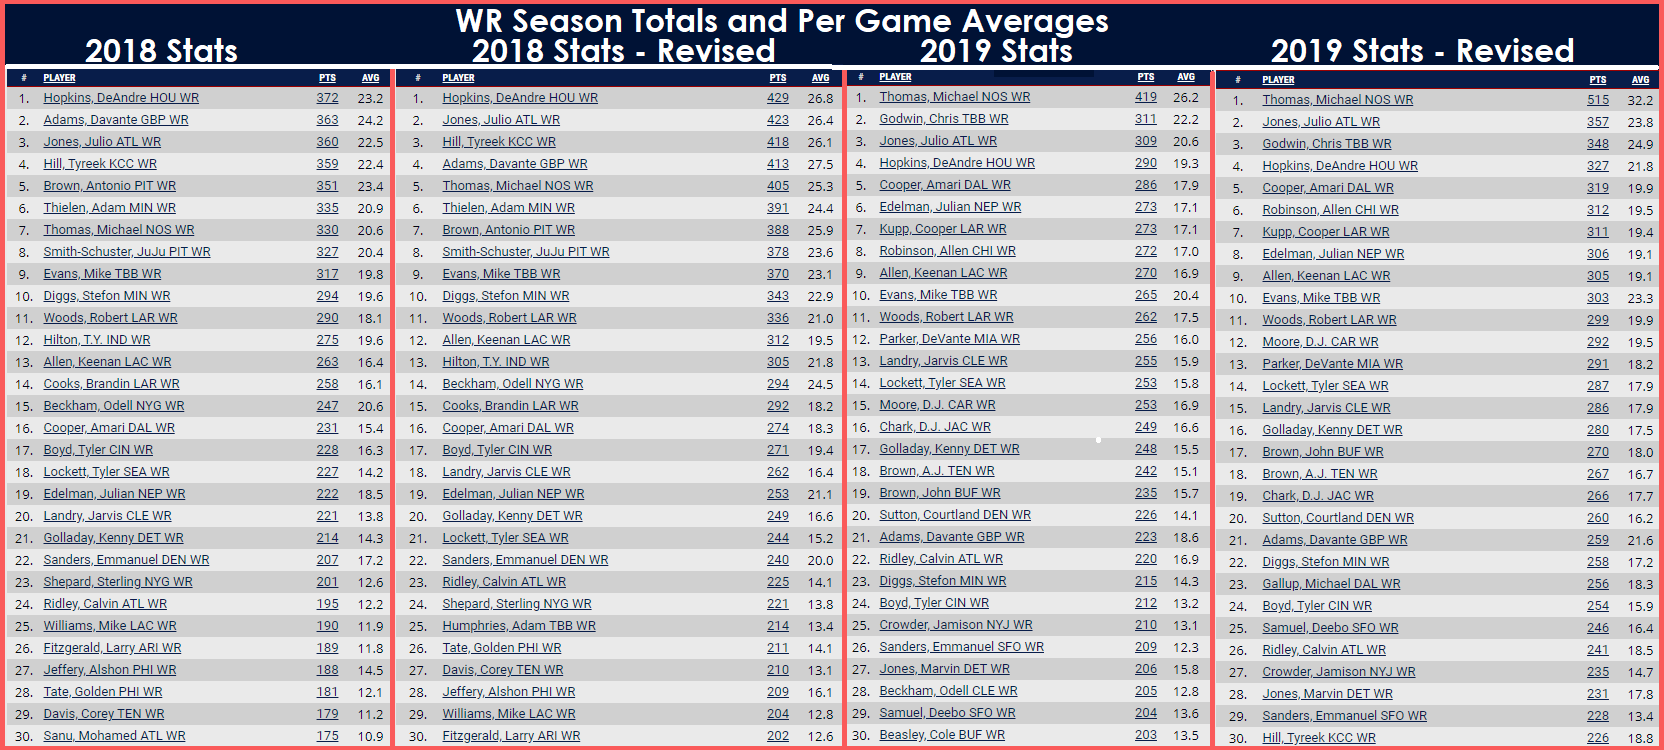
- Fig 3.1 shows a side by side comparison of the Season Scoring Totals and Per Game Averages of the top 30 WRs from 2018 and 2019 with the revised scoring
- Note the increases in scoring are a little smaller than the decreases for QB and RB scoring
- Note, also an expanded player depth for the top 2-3 tiers of receivers
- Also, the consistency of both sets under Revised scoring
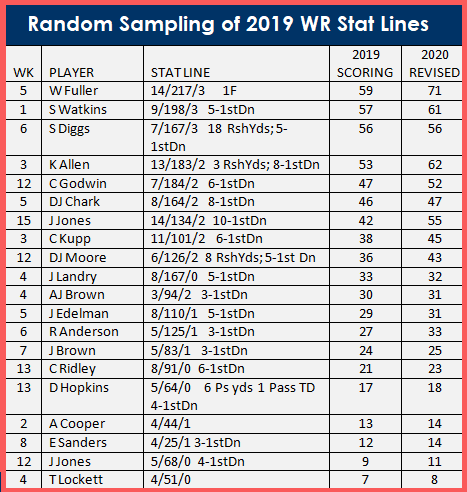
- Fig 3.2 shows a random sampling of 20 actual 2019 stat lines with a comparison of their 2019 scores and what their scores would be under 2020 scoring revisions
- Note the scoring increase is slight, and most pronounced for the really good and really average stat lines, while the mid range has less change
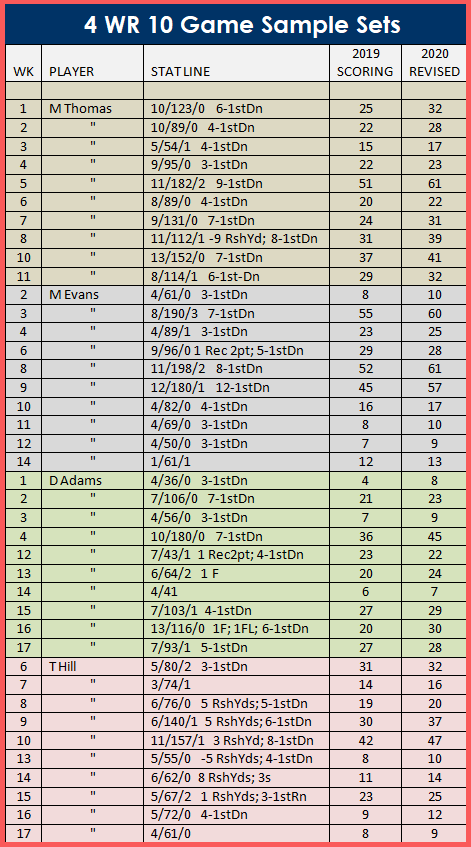
- Fig 3.3 Shows 10 game sample sets of 4 different WRs
- What's of note is essentially the same as in Fig's 3.1 and 3.2, that the scoring changes were minimum, that mediocre performances received an extra point or two to make them a little more relevant, but that highlight reel stat lines got the lion's share of the scoring boost they deserve
Tight End Scoring
Under 2019 scoring rules, Tight End scoring fell under "Receiving" rules, and because of the inflated QB/RB scoring and depressed WR scoring, it meant that only 2-3 Tight Ends were every week starting options. Because of the change with 2020 scoring revisions to scoring rules being drawn by position, it offers the opportunity to craft Tight End specific scoring rules to create a field of +/- 10 viable weekly Tight Ends. Below is a side by side comparison of the 2020 Revised Scoring Rules for the Wide Receiver (same as above) and Tight End positions. Notes on the changes are below that, followed by multiple comparison charts.
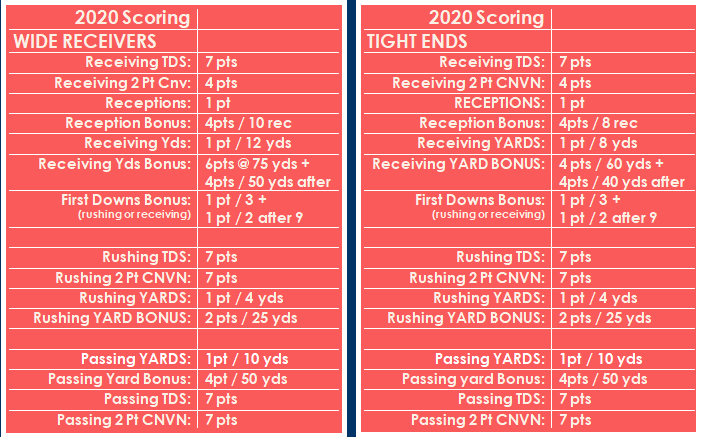
TE NOTES:
- TE scoring is set identical to WR scoring with the exception of yardage, yardage bonus, and reception bonus
- TE yardage scoring is 1 pt/8 yds compared to 1pt/12 yds for WRs ( 1pt/10 yds for RBs)
- TE Yardage Bonus is set as 4 pts for 60 yrds, then 4 pts every 40 yds after compared to 6 pts @ 75 yds, then 4 pts every 50 yds for WR ( 4 pts per every 60 yds for RBs)
- TE Reception Bonus is 4 pts for every 8 receptions (+1 pt per rec.) compared to WR 4 pts for 10 receptions (RB is 4 pts per 8 receptions as well, but without the 1 pt per rec)
OUTCOMES:
Below are multiple comparison charts, click on any of them to get an enlarged view; (NOTE: all references to "2020 Scoring" are 2019 stats with 2020 Rules applied to them)
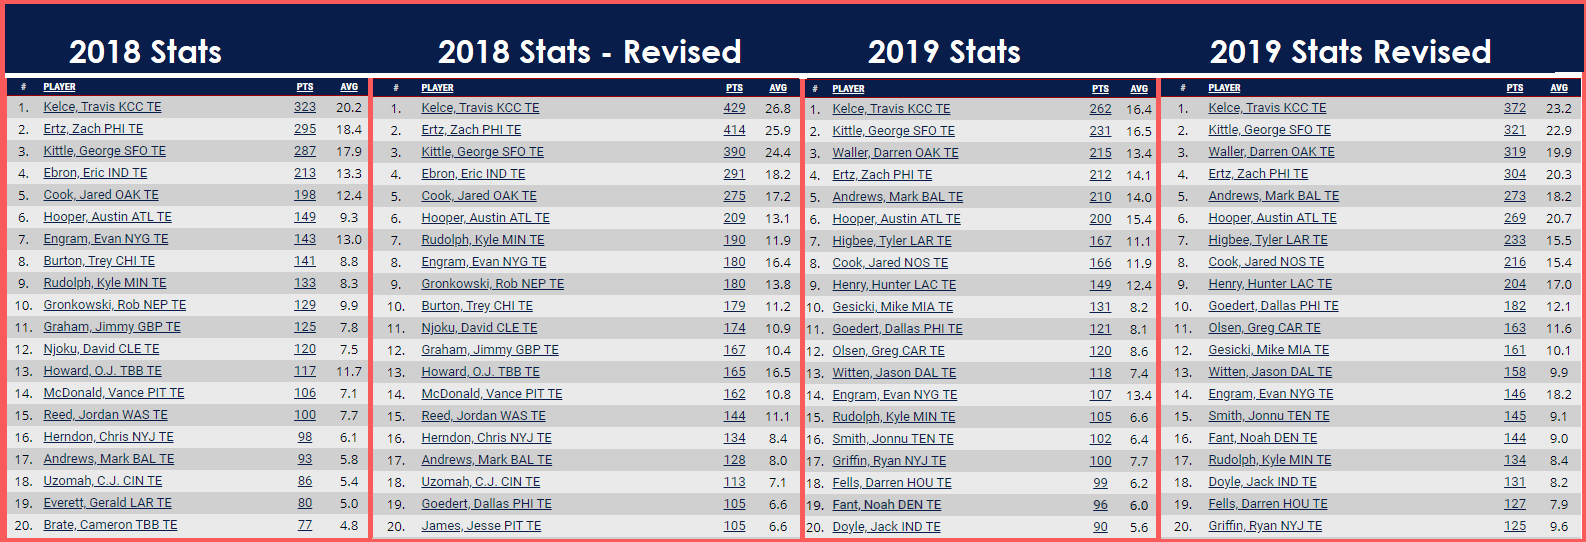
- Fig. 4.1 shows a side by side comparison of the Season Scoring Totals and Per Game Averages of the top 20 TEs for 2018 and 2019 with Revised scoring rules
- Of note is the boost to the per game averages, and in particular that the boost in scoring mainly affects the top 6-10 players, creating viable weekly starters
- Also note the consistency of same over both seasons
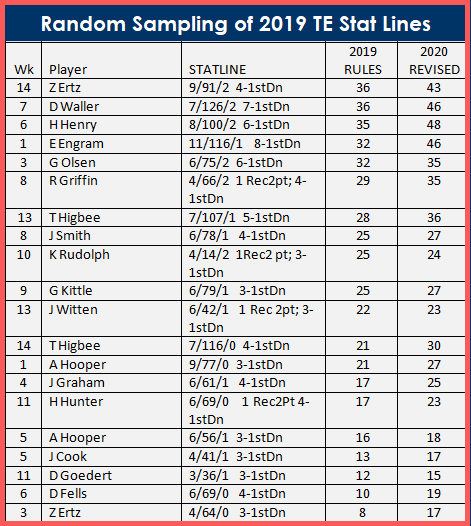
- Fig 4.2 shows a random sampling of 20 actual 2019 stat lines with a comparison of their 2019 scores and what their scores would be under 2020 scoring revisions
- Of note: statlines above about 75 yards and a TD produce fantasy scoring on par with highlight performances in the WR category (the top 7-10 entries)
- Also: low range stat lines are not completely lacking in value (the bottom 4-6 entries)
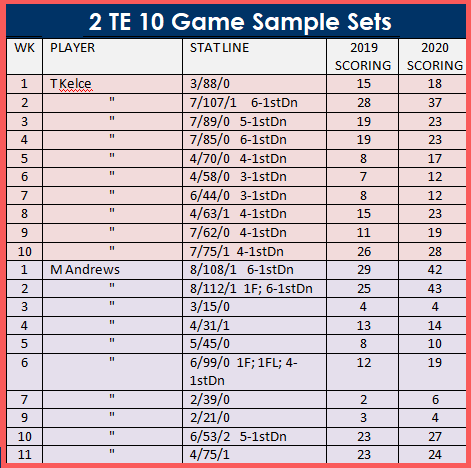
- Fig 4.3 Shows 10 game sample sets of 2 different TEs - Kelce remains the #1 TE under both 2019 and 2020 scoring rules and Andrews remains #5 under both
- Of note is the general improvement in week to week consistency
- Of particular note but not shown (more on this below in the section on positional parity) is that the scoring revisions (in combination with revisions at other positions) move Kelce from #58 overall all the way to #14 and move Andrews from #87 overall to #65 which seems 'real-world accurate'
Offensive Positional Parity
One of the biggest goals of the 2020 Scoring Revisions was to improve the parity of scoring (in relation to performance) across all positions. Keepeing in mind that the AFFL roster settings for offense are being changed to 1 Superflex starter and 4 Flex starters, positions should be looked at in a more interchangeable way, and scoring needs to offer value relative to all offensive positions not just within each position. Below are notes and samples showing how that was accomplished.
NOTES:
- There's a point in any NFL game when an individual player's performance in that game crosses a threshold from "an average day" to "a good day" (along with "a bad day" or a "great day")
- For different positions, though, there are different metrics for that - for example, an RB with 100 yards rushing is having a good day, while 100 yards passing is horrible game total for a QB
- There's no exact dividing line between an average to good performance, because there are a variety of factors (including yardage, TDs, turnovers, etc) so certain loose benchmarks for different positions were used as a guide stick for comparing performances in developing the Revised Scoring Rules; the following guidelines were considered to be generally 'equal' in game impact
- QB- 300+ yds, 2+ TDs, 0 interceptions
- RB - 100+ yds, 1-2+ TDs, 0 turnovers
- WR - 75-100+yds, 1+ TDs, 0 turnovers
- TE - 70+ yds, 1+ TD, 0 turnovers
BY THE NUMBERS
- With 5 offensive starters on 20 teams, that theoretically covers the Top 100 Offensive Players
- Actual 2019 Offensive Squad Scoring Average (by totals) was around 1200 or about 90 points per game
- Average score of the Top 100 Offensive Players (all positions) is 290 (season) and 17.10 per game (this would average to 85 offensive points per game)
- Average Score for Top 20 QBs is 359 and 22.42 per game
- Average Score for Top 20 RBs is 307 and 19.18 per game
- Average Score for Top 20 WRs is 295 and 18.46 per game
- Average Score for Top 10 TEs is 269 and 16.8 per game
- Top 100 Offensive Players breaks down to the following
- 31 QBs
- 25 RBs
- 35 WRs
- 9 TEs
- Score Averages for all positions(with top 3 outliers removed):
- Ranked #4-#23 = 386 and 24.15 per game
- Ranked #24-#43 = 300 and 18.75 per game
- Ranked #44-#63 = 273 and 17.05 per game
- Ranked #64-#83 = 245 and 15.85 per game
- Ranked #84-#103 = 227 and 14.20 per game
- Average Offensive Squad Scoring by this metric would come to 1431 and 90.00 per game
EXAMPLES:
Below are multiple comparison charts, click on any of them to get an enlarged view; (NOTE: all references to "2020 Scoring" are 2019 stats with 2020 Rules applied to them)
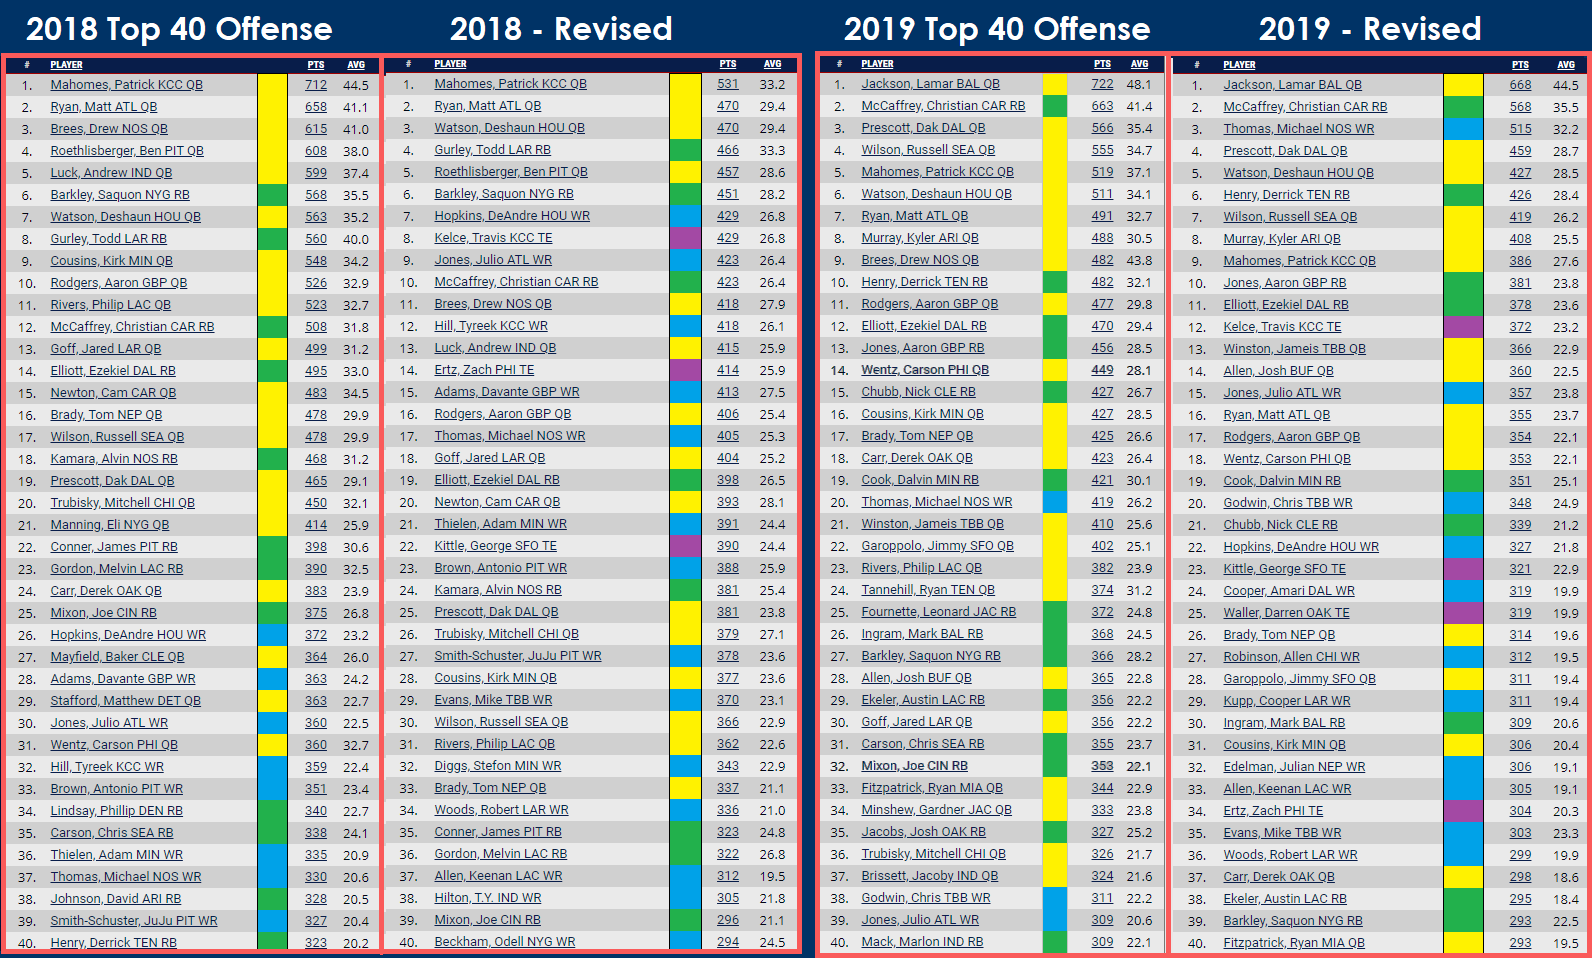
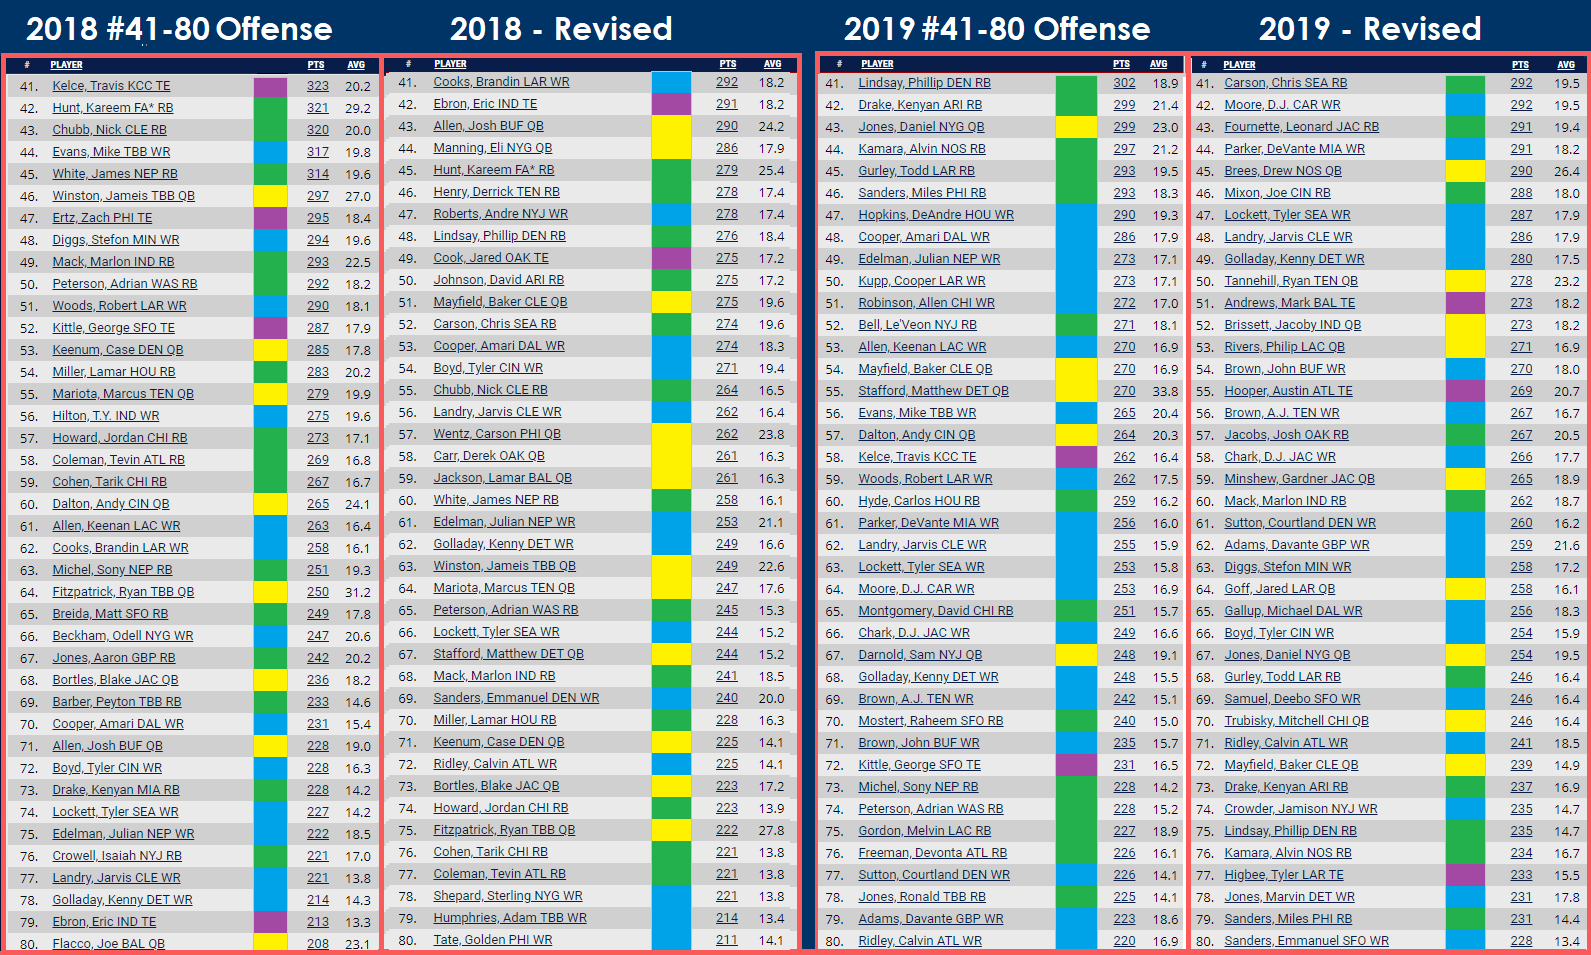
- Fig 5.1 shows a side by side comparison of the Top 40 offensive players by 2019 and 2020 scoring rules, and Fig 5.2 shows numbers 41-80
- Both have positional color codes in place that immediately show a greater diversity of position under the revised scoring
- Also of note are the total scoring numbers at the very top of the 2020 list are lower, but the further you go down the list, they began to even out with each other, while still 'spreading the wealth' across position
- On the top 40 in particular, looking at either total scoring or per game average, you can begin to see tiers; the tiers at the top of the 2019 list are much narrower, while on the 2020 list, once you move past the top 3 (coincidentally a QB a RB and a WR), you see tiers of talent that are much wider - this will both create more parity between rosters, as well as allow more formidable rosters and better competition
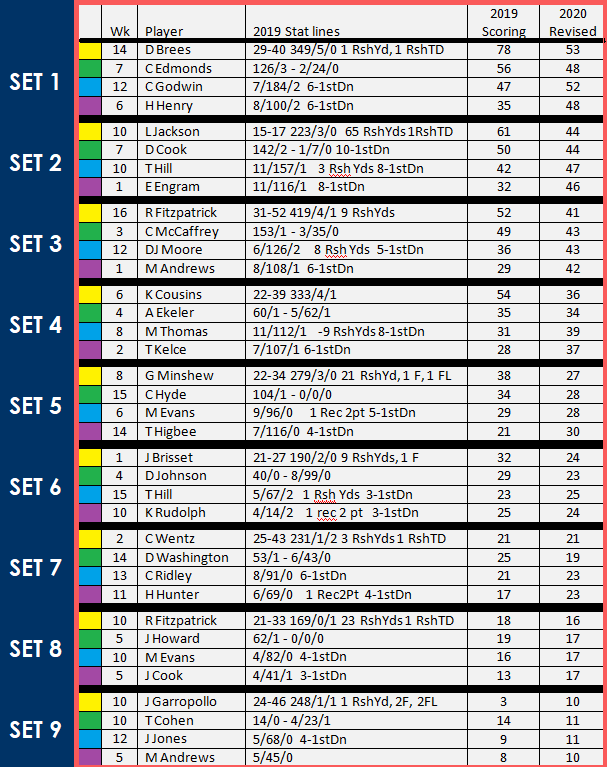
- Fig 5.3 shows 9 sets of stat lines - 1 each from QBs, RBs, WRs, and TEs grouped together, all 4 in each set with similar scoring numbers under 2020 scoring revisions
- In each set, note the similarity of the stat lines match the similarity of scoring, where scoring under 2019 rules for those stats show a much greater divergence
- In Set #1, for example: Brees' 350yd 6 TD game is clearly a much bigger performance than Henry's 100 yards and 2 TDS, BUT, 100 yards and a pair of TDs with 6 1st downs is a great game for a TE, and scores of 53 points and 48 points for the two performances in comparison to each other is a much more equitable set of scores than the 78 points and 35 points they received under 2019 scoring rules
- Set #3 shows a pretty equal set of stats from McCaffrey and Moore - in other words, 153/1 for a RB is about equal to 6/126/2 for a WR - but under 2019 scoring the two stat lines scored 49 and 36 fantasy points; the 2020 revisions would score the stat lines as a much more equal 43 and 43 points; also in Set #3, Fitzpatrick's 419 yards and 4 TDs seems like a much more valuable performance than either McCaffrey's or Moore's, BUT, a closer look shows Fitzpatrick also had just a 59% completion rate and a turnover, dulling the shine on those 400 yards and 4 TDs
- Set #6 shows a great set of parity between low yardage high (2) TD performances at QB, WR, and TE against a receiving threat RB that fails to score, but racks up yardage
- Set #9 shows an example of the 2020 scoring revisions bringing better consistency across positions for generally boring performances
Special Teams Scoring Revisions
All Secial Teams Scoring Rules - Kicker and Kick Returner - have been revised from the ground up, starting with a blank slate
Kicker Scoring
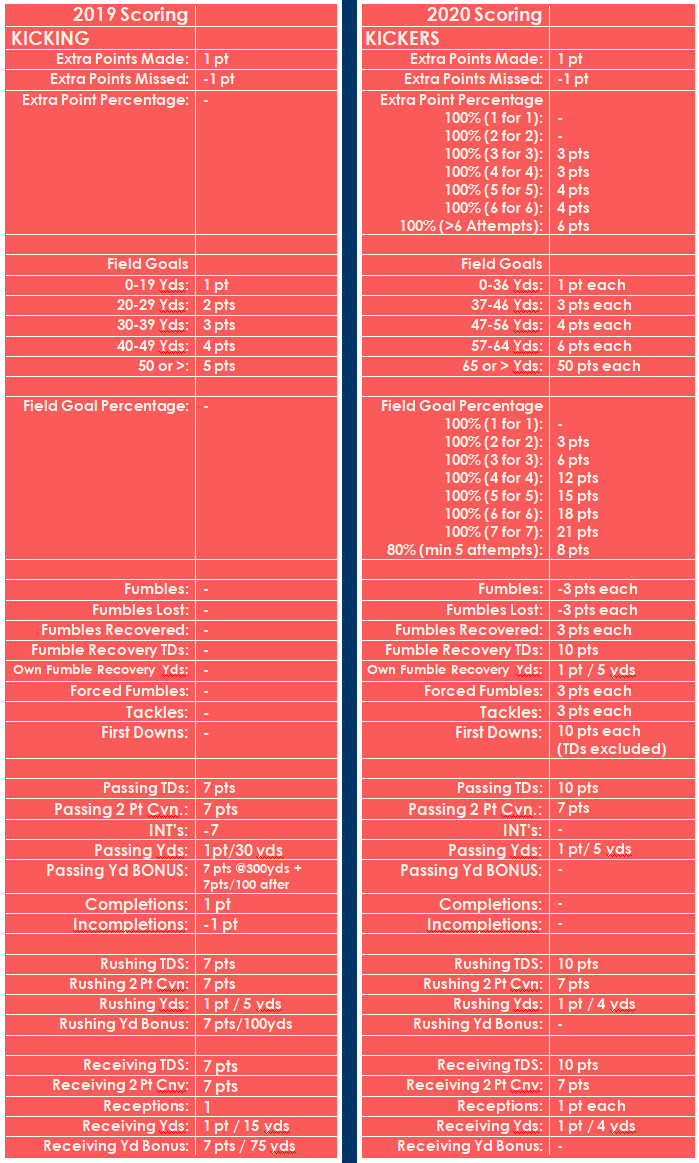
Below is a side by side comparison of 2019 and 2020 Scoring Rules for the Place Kicker position. Notes on the changes and comparison charts are below that.
REVISION GOALS:
- As stated, the Place Kicker Scoring Rules were redrawn from scratch rather than being a revised version of the 2019 rules
- The overall goal for Kicker Scoring was to create a system that fit the following rule of thumb:
- Kickers are not as important as offensive skill positions, so on average, they should not score as high, but kickers do have real world value to a team and can often have a big impact on a game's outcome, so the same should be true in fantasy
With the above in mind, a revised kicker Scoring System needed to meet the following criteria:
-
- Per game averages should fall in the 10-15 point range
- Kicker scoring should skew towards good kickers, rather than average kickers on bad teams
- There should be a noticable difference in value between kickers in the top and bottom half of the top 20, so that teams investing in a higher end kicker gain a slight edge for their investment
NOTES:
- The Bottom Half of the charts above show that under 2019 scoring rules, Kickers doing anything other than kicking (pass, rush, receive) - as in, for a trick play -were scored as if they were QBs, RBs, or WRs; this has been changed giving Kickers an opportunity to cash in on any successful trick plays
- The scoring for these non-kicking plays are valued to translate the excitement and momentum value of a successful trick play into fantasy points
- In the Middle of the chart above - the section on fumbles - shows that kickers were not scored for fumbles in 2019 (an oversight)
- Under 2020 scoring, Kickers are negatively scored for fumbles at a higher rate than offensive players (-3 compared to -2); this is to account for the generally greater impact of a turnover occuring during kicking attempts (field goals)
- BUT under 2020 scoring rules, Kickers can also benefit from tackles, forced fumbles, and fumble recoveries, should a turnover happen
- The Top section of the chart above represents the main area of kicker scoring
- Goals #2 and #3 from above have been accomplished by heavily weighting the scoring values toward skill (distance and accuracy) rather than volume or opportunity
- Extra Point Percentage is a bonus awarded only for a 100% success rate, on a sliding scale of number of attempts
- Field Goal Percentage is a bonus for a flawless (or near flawless) performance that can escalate to a very high value based on the difficulty of staying flawless (higher the number of attempts, the more difficult it becomes to be 100%)
- The bonus for an 80% success rate (minimum 5 attmepts) would only be awarded if a kicker goes 4 for 5, 5 for 6, or 6 for 7
- Field Goal Yardage is pretty self explanatory; the relatively low values for field goals (compared to accuracy bonus) mean that kickers will receive most of their fantasy scoring from accuracy, and then from difficulty (distance), and then lastly from volume
- NOTE ON FIELD GOAL LENGTH YARDAGE VALUES: "Length of Field Goal" is not measured as goal line to line of scrimage, but is measured as the ACTUAL LENGTH of the field goal - from the hold to the goal post - which adds approximately 16-17 yards to whatever the line of scrimage is
- Therefore a 36 yard field goal (lowest range - 1 point) would be from a line of scrimage of around the 20 yard line; a 57 yard field goal (high range - 6 points) would be from a line of scrimage of around the 40 yard line
- 50 Point Bonus - the NFL Field Goal record is 64 yards; a 50 point bonus for field goals of 65 yards or longer was included in the scoring for a bit of fun. This can be removed before the season starts if multiple teams request it to be
- Extra Points - the original plan did not include giving points for extra points since they're a near-universal 'gimme'; they WERE however included in the final revision as a neccessary way to 'bulk up' the overall scoring to get it into the desired range
SAMPLES
Below are multiple comparison charts, click on any of them to get an enlarged view; (NOTE: all references to "2020 Scoring" are 2019 stats with 2020 Rules applied to them)
- Fig 6.1 shows a side by side comparison of the total and per game average scoring of kickers for 2018 and 2019, both with Scoring Revisions
- Note an overall increase in kicker value; the #1 kicker would have produced a season total of 207 points under 2020 scoring rules, putting him just outside the top 100 offensive player scores - in a league of 20 teams with 5 offensive starters each, that puts the best kickers theoretically right behind offensive starters in value
- Note also the overall difference in value between the top 10 and bottom 10 kickers - making the top half of kickers roughly 50% more valuable than the bottom half; just enough to give half of league teams a slight advantage, but not a dominating one
- Also note the consistency of the revised versions season to season
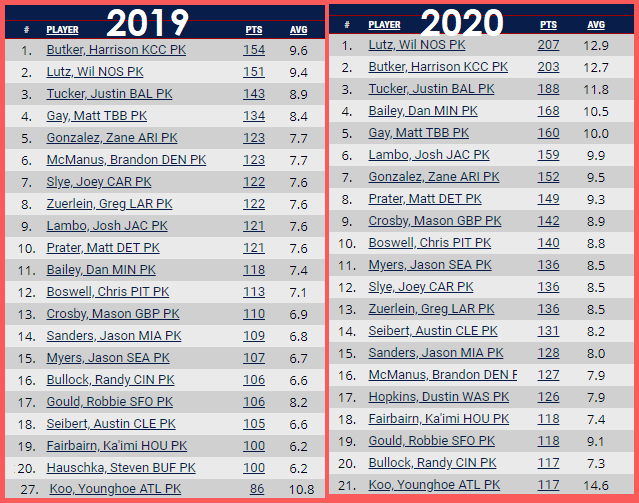
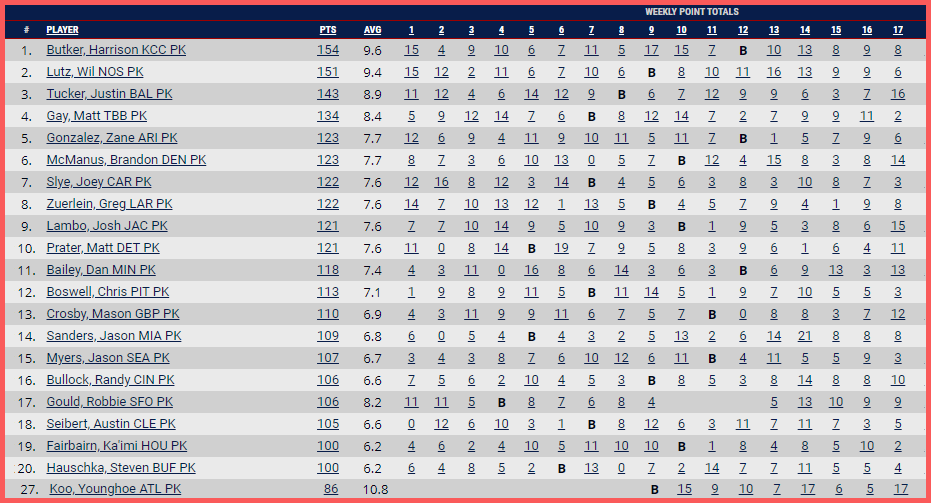
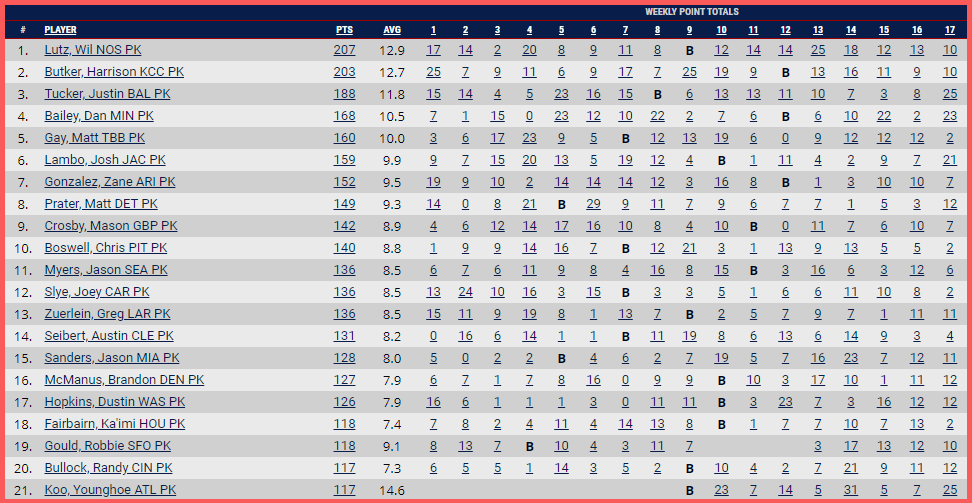
- Fig 6.2 and 6.3 show the full set of stats for the top 20 Kickers under 2019 and 2020 scoring rules, respectively
- Younghoe Koo is included because his stats would have put him high in the field had he completed an entire season
- Note that his value jumps from #27 to #21 under revised scoring rules
- A look at both graphics shows a very marked improvement in week to week scoring and scoring consistency - particularly for the top half of the field - giving Kickers a much more realistic impact on weekly team scoring totals
- Younghoe Koo is included because his stats would have put him high in the field had he completed an entire season
EDIT NOTE: value for 1st Downs was changed from "10 pts each (TDs excluded)" to "4pts each (TDs excluded") after production of included graphics. The change does not significantly affect either the statistics or the conclusions of the Kicker scoring notes & edits
Kick Returner Scoring
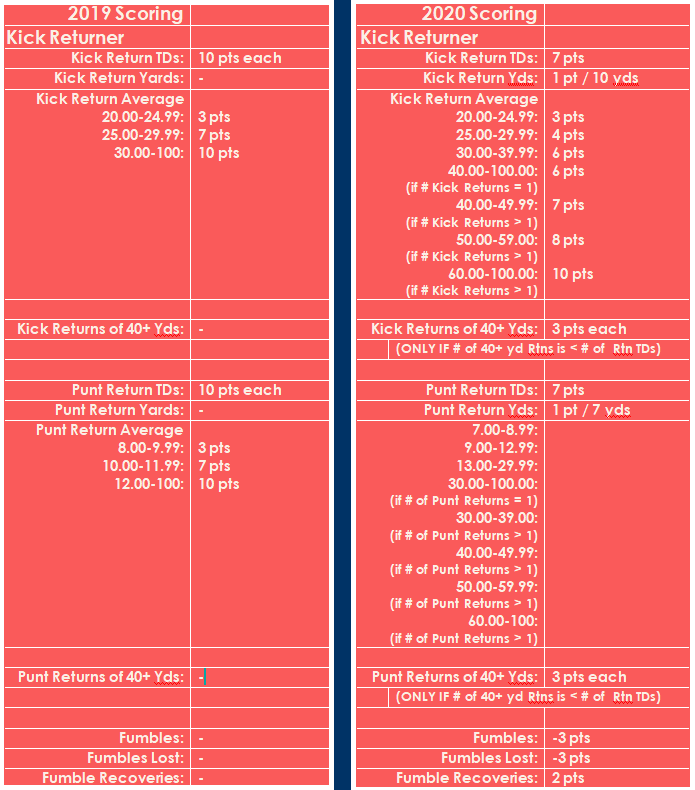
Below is a side by side comparison of 2019 and 2020 Scoring Rules for the kick Returner position. Notes on the changes and comparison charts are below that.
REVISION GOALS:
- Like Place Kicker scoring rules, the scoring rules for Kick Returner were redrawn from scratch
- A brand new set of rules with multiple revisions was done twice - and then scrapped; the third set of rules went through 22 revisions before the final revision set was decided on
- The baseline of stats used for developing were the kick return stats for the NFL's top 20 returners of 2019
- Goals for Kick Returner Scoring were similar to Kicker revision goals and followed a similar reasoning:
- Kick Returners do not have nearly as much real world value as offensive (or defensive) skill position players, or even kickers, BUT a handful of teams DO have returners that are legitimate weapons.......
so....
-
- Top returners should get their value based on performance, not just from being on a bad team and getting lots of return opportunity
- Scoring should be such that it creates 4-6 returners capable of producing per game averages in the 10-15 point range (with the occasional lottery ticket from a return TD)
- There should be a noticable drop in value among kick returners after those first 4-6 players
- But the remaining (top 20) returners should retain as much consistency as possible with per game averages falling between 0 and 10 points and negative values kept to a minimum
NOTES:
- The Kick Returner scoring rules were incredibly difficult to dial in; part of the problem was the limited role they play in a game - which makes for a limited range and amount of stats to quantify
- A big problem with Returner Stats was accounting for the boom or bust nature of big plays - namely, Return TDs
- In AF Leagues with team Def/Sp Teams, return TDs are usually given a value of 10 points, and that was the starting point used for developing the kick returner rules
- The problem that led to is that a return TD generates not only a TD, but lots of yardage as well, so with scoring yardage, yardage averages, and TDs, you ended up with situations where a single play could generate massive amounts (sometimes 20-30+) of points
- TD value was lowered to 4 points in several revisions to account for that - and it helped - but between the nature of the position and available stats to grab fantasy scores from, a return TD could still generate double digit points from the one play
- The only real stats available to work with are total return yardage and average return yardage; in the end, it just came down to playing with the values and creating lots of conditional fields untill the season numbers looked about right
- Ultimately, more revision may be neccessary after another season of data
SAMPLES:
Below are multiple comparison charts, click on any of them to get an enlarged view; (NOTE: all references to "2020 Scoring" are 2019 stats with 2020 Rules applied to them)
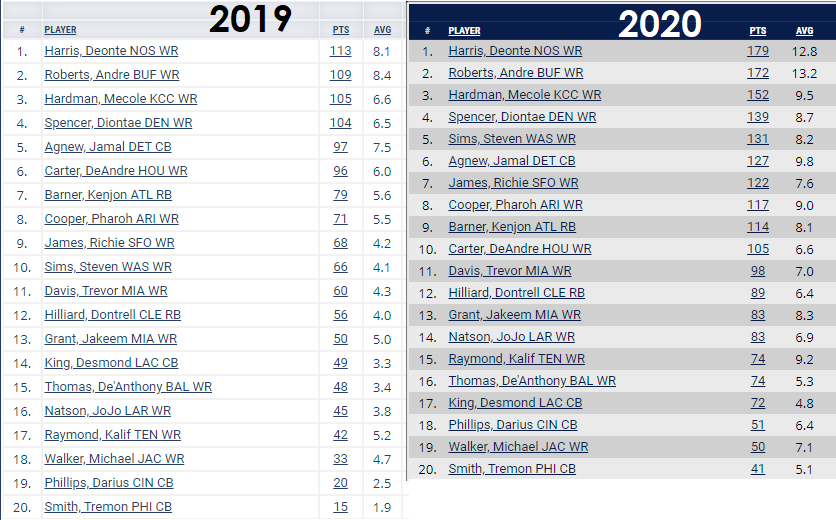
- Fig 7.1 shows a side by side comparison of the total and per game average scoring of kickers under 2019 and 2020 rules
- Note the overall values are increased across the field from top to bottom, and - more importantly - there's a very noticable difference between the top and bottom half of the Top 20 (both in total scoring and in per game averages) compared to 2019 rules where the scoring difference was gradual and (mostly) negligible
- Also of note the top 4 or 5 returners have pretty decent value when compared with all the others - that will allow the AFFL to mimic the real world, where only about 25% of teams have legitimate week to week return threats at the kicker position
- The top 3 returners (by total points) fall somewhere in the top 100-150 scorers if compared to all offensive player; that would put them just a little lower than the theoretical 100 offensive starters
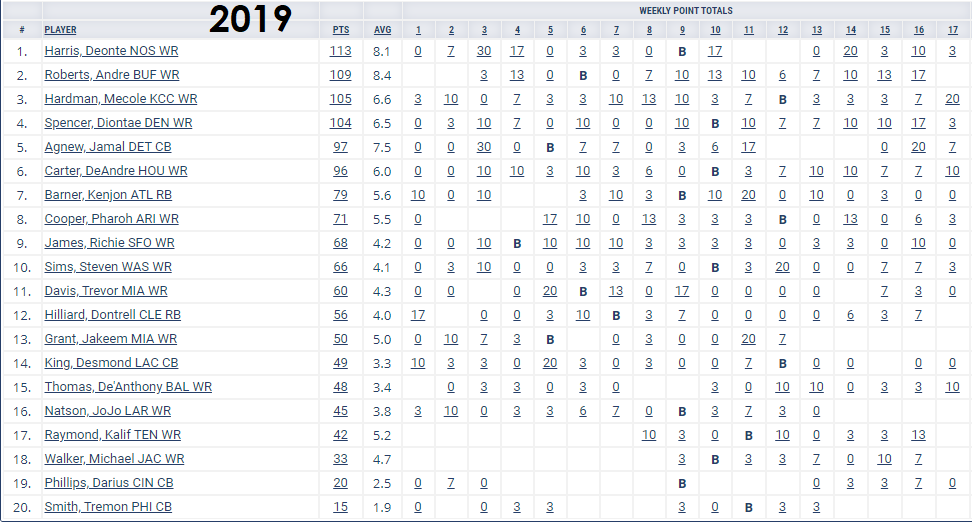
- Figs 7.2 and 7.3 show the full range of weekly scoring for the top 20 returners under 2019 and 2020 scoring. respictively
- Note the improvement in overall week to week scoring and consistency from 2019 to 2020 across the board as well as an improvement in weekly advantage for Kick Returners in the top half of the field of 20
Punter Scoring
Punter Scoring? We're using punters now?
Note from Crash:
"After one beer: 'Hey, maybe we should use punters'
After two beers: 'No, that's a horrible idea'
After an undisclosed number of beers: 'Punters! What an awesome idea!'
The next morning: 'Punters? What a terrible idea............yet still pretty awesome'
No, seriously, I've been planning this for a while. Consider the following scenario: It's late in the game, Monday Night Football, multiple fantasy match-ups hang in the balance. Team 1 is down by 6 against Team 2, 4 minutes to go with the ball on their own 20 yardline. Team 1 QB drives down the field, hitting multiple WRs and an RB, scoring a TD. The Kicker kicks the go-ahead extra point. After a kick and a touchback, Team 2 takes over, with about two and a half minutes to go. The QB throws a screen pass to the RB, he breaks free and takes off down the field, racking up 60 yards before being caught from behind by a Safety that forces a fumble. Team 1 recovers, but goes 3 and out as Team 2 uses timeouts and the two minute warning to preserve the clock. The Punter comes out to punt and nails a beauty that pins Team 2 at the 3 yard line. First play of the drive, Team 2 QB drops back to pass and a DE gets through for a sack safety. Boom. Game Over. And everybody that touched the ball in that last 2 minutes of the game had some impact on the fantasy results for the week. Except for the Punter.
So yeah, why not use a punter?
The way I see it, though, is that the only way using a punter makes sense, is if the scoring can be set up to meet the following criteria:
- Except for outliers, Punters should not score more than 10 points a game
- There should be a reasonable advantage to having one of the top punters compared to just picking anyone
- Scoring should not be based on a punter just being on a bad team and getting lots of opportunity
- There should be some week to week consitency of scoring
So I set to work to see if I could make that happen."
NOTES:
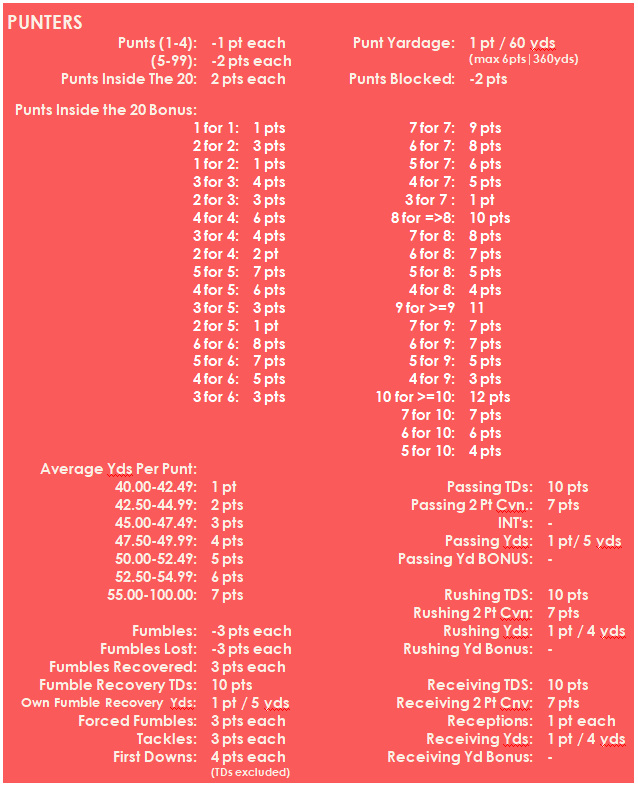
- Punter scoring rules went through 56 revisions to get to the final product
- Part of the problem is there are so few stats punters can be scored on, and even fewer stats available on MFL for scoring (for example, there's no available category for Net Yards Punted, only Gross Yards)(I was greatly disappointed to learn that ESPN actually has more scoring categories for punters than MFL)
- Creating a system that came close to meeting the criteria set out above was literally like threading a needle between overvalueing punters and valueing them so low there was little difference between best and worst
- The most useful scoring category available was "Punts inside the 20" but using that stat alone with a low value(1-2 points each), produced very little difference top to bottom; using it with a higher value (3+ points each) created a boom or bust set of season stats where scores varried wildly and often went into the 20 and 30+ point territory
- The closest thing to a solution was to create a "Punts inside the 20 Percentage Bonus" category through a system of conditional values
- Added to that was a 'completion/incompletion' type of set up where every punt attempt scored -1, while every punt within the 20 scored +2 (for a net gain of +1)
- even this, on its own wasn't sufficient, I played around with values and conditions a lot, finally coming to a system that gave -1 point/+2 points for the first 4 punts, and then -1 point/+1 point for punts beyond the first 4 (on one set of revisions I tried making the first punt 'free', and I was initially excited about the results, but it kept the gap between the top and bottom punters too close)
- The two manipulated rules above created a bit of week to week consistency and scoring in the low end of the desired range, but still not enough separation from top to bottom
- Punt length percentage scoring was added to bulk the scoring up a bit - and I played around with that through tons of variations
- And then scoring was further enhanced by minimal punt yardage scoring - which I had to cap off at a maximum of 360 yards/6points to prevent punters on bad teams from moving to the top of the list just on opportunity
- Non-Punting Rules (for passing, rushing, TDs, etc as in for fake punts) from the revised Kicker Rules were added, but did not factor into the overall revision process (although they do create a few high scoring weeks scattered throughout the season on those occasions when teams run a successful fake punt
So here they are........
RESULTS and SAMPLES
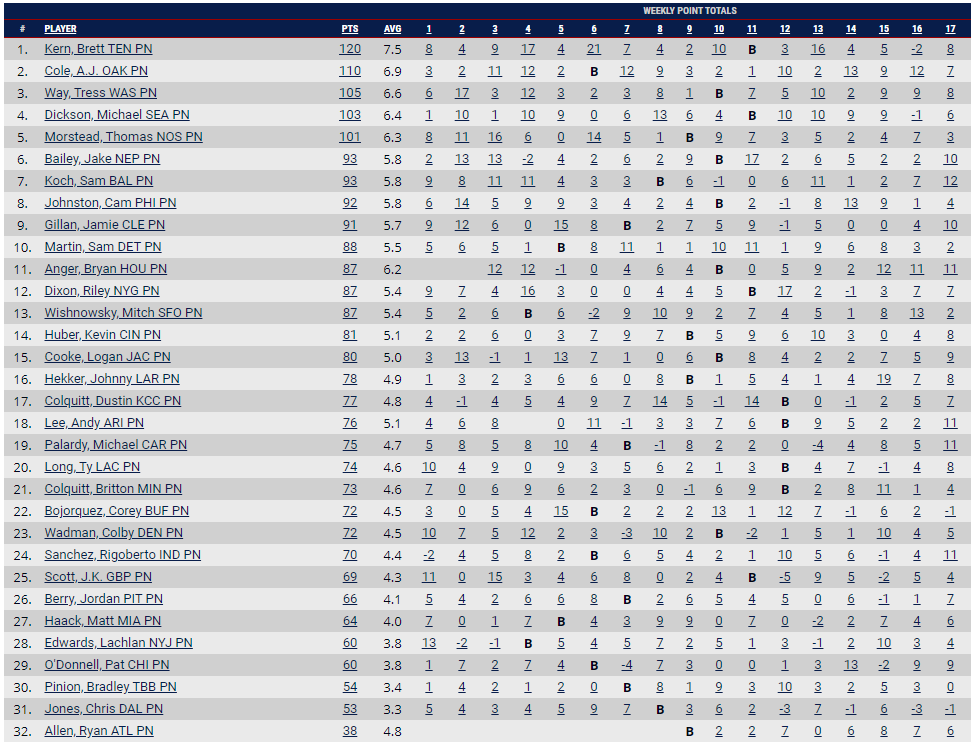
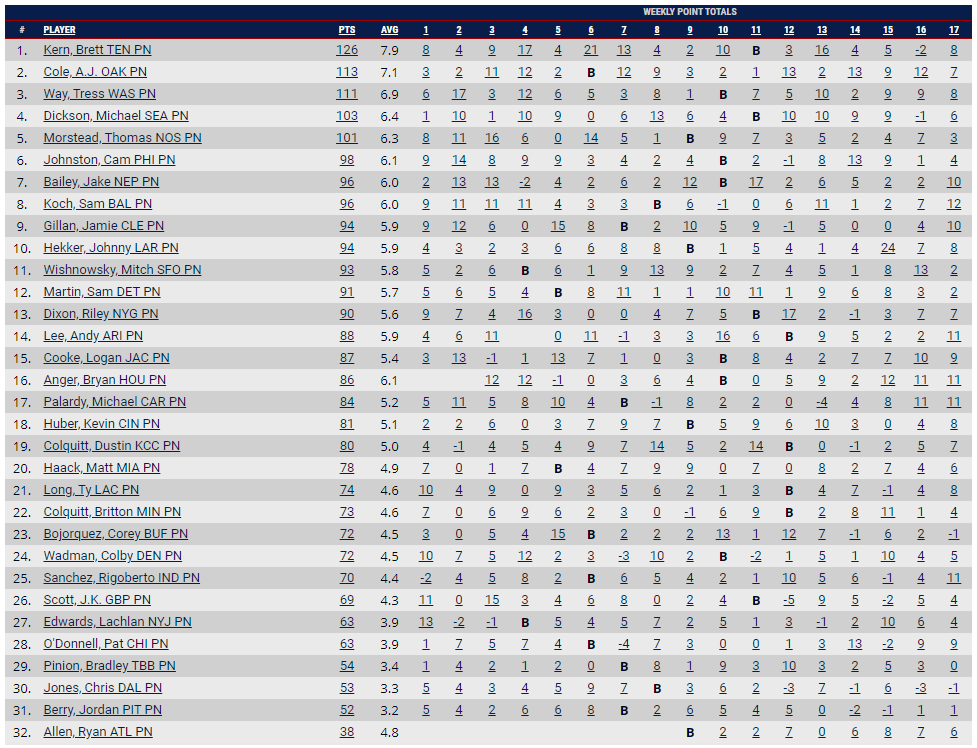
Fig 8.1 - shows stats for the top 32 punters of 2019 with the new Punter Scoring Rules Set, with ONLY punting rules applied (in other words without passing, fumbles, etc)
- The 4 criteria set out above as goals for punter scoring were:
- Except for outliers, Punters should not score more than 10 points a game
- There should be a reasonable advantage to having one of the top punters compared to just picking anyone
- Scoring should not be based on a punter just being on a bad team and getting lots of opportunity
- There should be some week to week consitency of scoring
- Through the best efforts, completely fulfilling all criteria as laid out above for setting up a system of punter scoring was only partially succesful
- The highest weekly scores contain more double digit scores than was desired - it was hoped weekly scoring would not rise above 10 points per game except for in a handful of outliers (Brett Kern's week 6 performance was a particular thorn in my side); however, the overwhelming majority of weekly scores fall <= 10 points, and most of the outliers are not much above 10 points (with a few exceptions - some of these are detailed in the notes on Fig 8.2), it's not optimal, but still falls in the acceptable range
- The per week average score for punters under the rule set ranges from 7.5-4.6 for the top 20 which is a much smaller margin of spread from best to worst than desired (I had hoped for a 5-7 point margin instead of the 3 point margin it worked out to
- However, a look at Fig 8.1 shows that when looking at season long, weekly scoring there is a clearly discernable overall advantage to having a punter in the top half of punters when compared to the bottom half despite the low spread
- Goal 3 was that punter scoring would not reflect higher rankings for punters on bad teams but rather higher rankings for the more effective punters
- This is a rather hard metric to quantify, however, looking at Fig 8.1 and and just going 'by instinct', the NFL punters that are generally considered to be better than average tend to trend toward the top of the list
- Almost all sources for 2019 punter rankings have punters ranked by raw statistics, however I did find 3 sources ranking punters by their own assorted metrics of "value" and when the top 10 from those lists, are compared to the top 10 on Fig 8.1, they show 8, 6, and 7 (respectively) punters appearing in the top 10 on both lists (not neccessarily at the same rank) - all three rankings lists showed at least 9 of the top 10 from Fig 8.1 ranked in their top 14
- Week to week consistency is also hard to quantify, but a look again at Fig 8.1 shows that consistency is not bad, and improves on the top half of the rankings over the bottom half
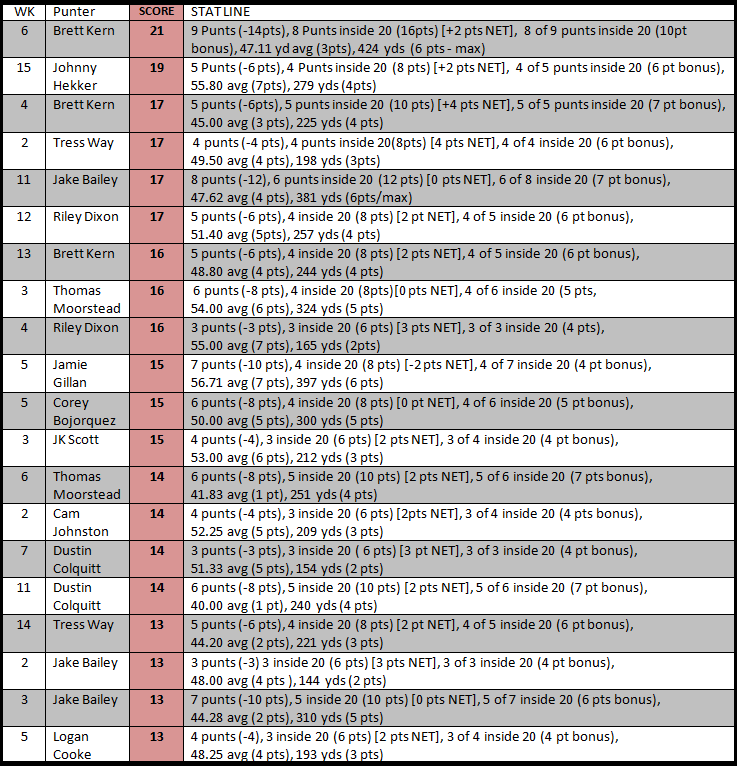
Fig 8.2 shows the top 20 individual scores and statlines (2019) which includes all individual scores of 13 points or more for the season to give a stats-based explanation to the high/outlying scores
- Note that goal #1 was to limit punter scoring to 10 points per game - "except for outliers": of 536 individual punter scores in 2019, punter would have scored 13 points or more only 21 times (3.9%) and 11 points or more only 46 times total (8.5%)
- Also note the majority of scores above 10 points are from punters in the top half of the field
- The examples in Fig 8.2 show the stat lines explaining each score and, particularly when looking at identical scores, shows just how performance based the scoring rules turned out to be
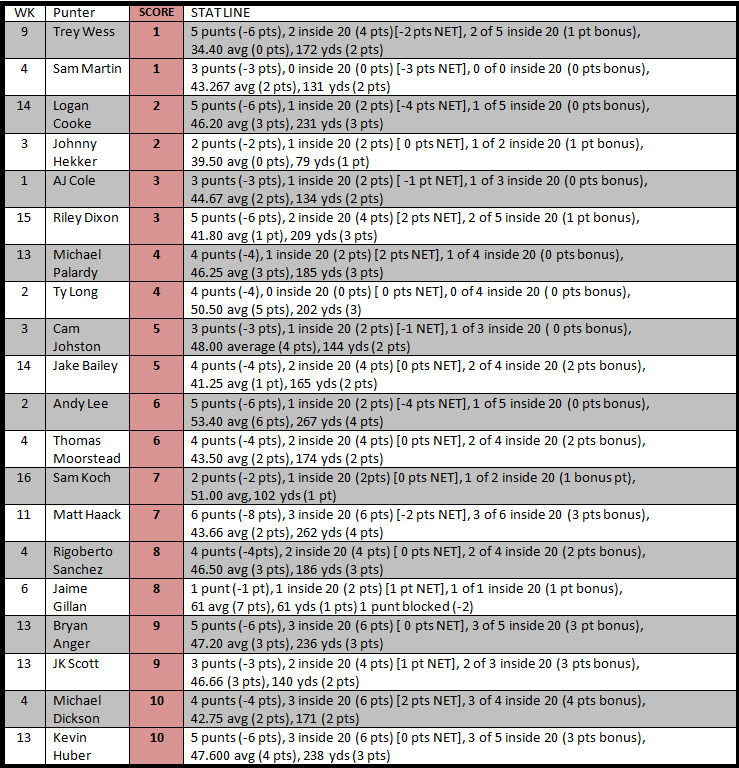
Fig 8.3 shows 20 individual scores and statlines between 1 and 10 points to put a context to the weekly scores
- Like Fig 8.2 it shows how well the scoring values work out to be performance based; it's noteworthy that high scores are not always a product of higher usage and vise versa - in other words a high number of punts sometimes produces a high score, but sometimes a low one (based on other performance metrics) and a low number of punts can still produce a high score
- EXAMPLES: in Week 9 (line 1) Trey Wess punted 5 times, but only managed 1 point because of inferior performance, while in week 6 (line 16) Jamie Gillan scored 8 points from a single punt (and that includes a -2 for a blocked punt) because he dropped a 61 yarder inside of the 20
Fig 8.4 shows what the individual weekly scores of punters in 2019 would have been with punting rules AND ancillary rules (like tackles, passing yards, 1st downs, etc) included (Fig 8.1 shows only punting rules applied.) Below, is a guide to those weekly scoring differences for the Top 20 punters on the Fig 8.4 list (NOTE that some of these stats/scores may have been earned by punters while playing as holder in field goal formations as in Matt Haack's week 13 touchdown)(Note also that some adjustments may have been missed)
- The following punters scored an additional 3 points each for 1 tackle in the weeks specified:
- AJ Cole (wk 12), Trey Wess (wk 5 & wk 6), Cam Johnston (wk 1 & wk 3), Jake Bailey (wk 9), Sam Koch (wk 2), Jaime Gillan (wk 9), Sam Martin (wk 4), Riley Dixon (wk 9), Mitch Wishkowsky (wk 6 & wk 8), Johnny Hekker (wk 1), Andy Lee (wk 3), Michael Pallardy (wk 2)
- Other Stat Adjustments on Fig 8.4:
- Brett Kern (wk 7) - 11 passing yds (2 pts), and 1 1st down (4 pts)
- Logan Cooke (wk 9) - 1 fumble (-3 pts)
- Logan Cooke (wk 16) - 7 yds passing (1 pt) and 1 1st down (4 pts)
- Johnny Hecker (wk 7) - 23 passing yds (4 pts) and 1 1st down (4 pts)
- Johnny Hecker (wk 15) - 5 pass yds (1 pt) and 1 1st down (4 pts)
- Dustin Colquitt (wk 10) - own fumble recovery (3pts)
- Andy Lee (wk 10) - 26 passing yds (5 pts) and 1 1st down (4 pts)
- Michael Pallardy (wk 16) - 12 passing yds (2 pts) and 1 1st down (4 pts)
- Matt Haack (wk 7) 2 rush yds (0 pts) and 1 ist down (4 pts)
- Matt Haack (wk13) - 1 passing yrd (0 pts) and 1 TD (10 pts)
Defensive Scoring Revisions
 The entire premise of the AFFL was to create a 20 team league without diluting the available talent pool of players by including IDP scored in a way that made them just as valuable as offensive players - it's a concept other (12 and 16 team) AF Leagues have used to great success. After the inaugural 2019 season it was clear that the necessary offensive/defensive parity was not initially achieved so that was the main reason for the 2020 score revisions
The initial plan for creating offensive/defensive scoring parity was to revise offensive scoring down and to revise defensive scoring up with just some minor adjustments so that they could 'meet in the middle'. Upon an initial review of defensive scoring after offensive revisions were complete, it became clear that that was not going to work - offensive revisions did not drop offensive scoring down to defensive scoring levels, and defensive scoring values were already in unrealistic fantasy scoring territory, and yet still not on par with offensive scoring.
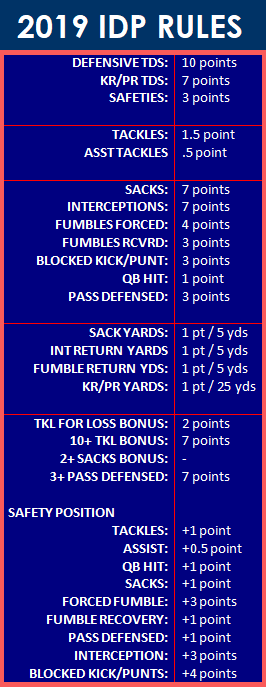
The next option was going to be no defensive revisions, but instead, adding a 6th IDP starter to create parity with the 5 offensive starters. But that didn't work either; after running the numbers, the per game average for a 6 player defensive squad was still just 75 points compared to 90 for an average group of 5 offensive starters. A new approach was needed, so a complete 'from the ground up' redesign was done. 2019 Defensive Scoring Rules are at right (click to enlarge); Revised Defensive Scoring Rules are below, with notes and samples below that.
REVISED IDP SCORING RULES

NOTES:
- The new redesign incorporated a previously discarded idea of using separate scoring values for different positions (similar to what was done on offense)
- Using different scoring rules for different positions (like with Tight Ends getting their own set of receiving rules) would increase the field of viable every week starters and give coaches more options for building a roster
- While offensive scoring was made to be equitable across positions, defensive scoring was designed to give different pros and cons to starting players from different positions
- Safety was made to retain its role as "Defensive Quarterback" by giving the position generally amplified scoring values
- Linebackers were given well-rounded scoring across the board
- Defensive Ends and Tackles were given scoring values that emphasized work behind the line of scrimmage - sacks, TFLs, QB Hits, etc with increased potential given to Defensive Ends for particularly disruptive game performances (sacks, QB hits, etc)
- The boom or bust nature of Cornerbacks as an IDP option was amplified by giving them scoring values that made them really boom for big plays to make up for the busts in between
- With offensive revisions, the goal was to get the scoring more real-world realistic ........BUT.....with the defensive revisions, making them both realistic AND on par with offensive scoring was not entirely possible, so instead the main goal became just getting them on par with offense while remaining as close to realsitic as possible
- Inconsistency (week to week) is part of the nature of the beast with IDP scoring, another is overlapping scoring values - a player might score fantasy points for a tackle, tackle for loss, sack, forced fumble, and fumble recovery all on one play; or for an interception, 50+ yard return, and a touchdown....both of those examples could lead to a 20-30 point single play if scores were set too high for individual rules
- We've tried to thread the needle of both that inconsistency, the unrealistic nature of that overlapping scoring rule points bonanzas, and parity with the offense
- Baseline scoring values were given individually to each IDP position in all categories, and then they were adjusted incrementally (based on position) until overall scoring reached the desired levels, with emphasis placed on using bonus points for multiples of events to increase the defensive scoring totals of individual players per game
- Once all possible scoring categories were defined and valued for all positions, defensive scoring overall still lagged too far behind the offense; kicker scoring rules gave us the idea for the solution....
- Tackles were originally valued at 1 point each (2 points each for DEs and Safeties)
- The plan for kickers was originally not to score for extra points, but when kicker average scoring was not at the necessary level, extra point scoring was reintroduced because all kickers would get a boost in overall scoring from it
- So, in the same way, tackle values were raised across the board for the same reason - that left DE's and Safeties scoring 3 points per tackle, which isn't necessarily a realistic value - but because tackle value affects all IDPs across the board, it worked to boost all scores into the range they needed to be to keep pace with offense
SAMPLES:
- The examples at right (click to enlarge) show very small sample sets, but still serve as a good snapshot of the results of the revised defensive scoring rules
- They also show the weekly scoring totals for the top 20 at each defensive positions, giving a general idea of what to expect per game scoring under revised rules to look like
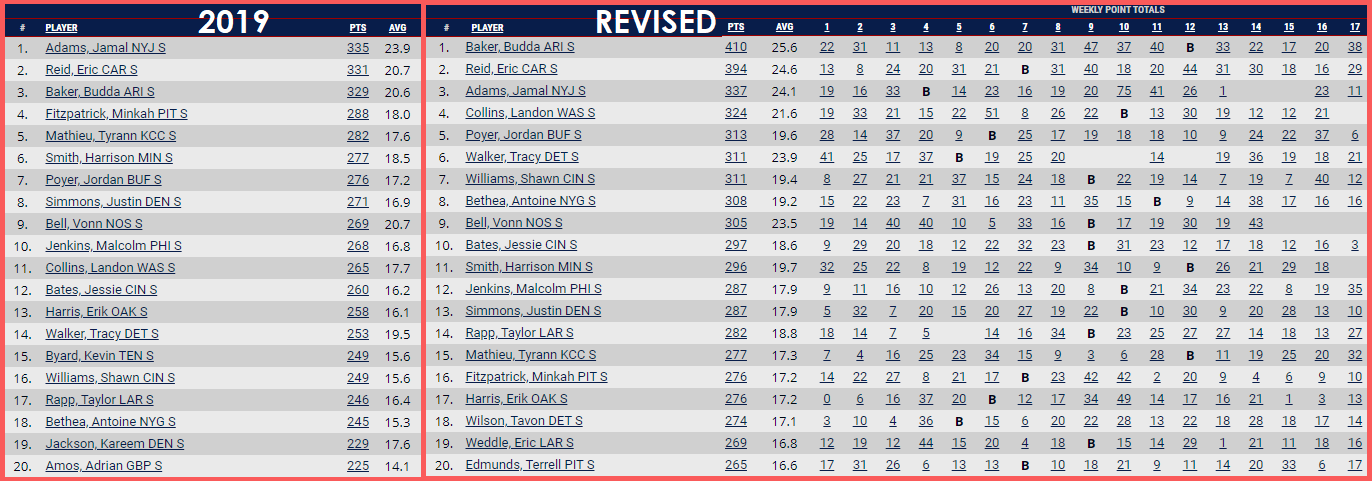
- Fig 9.1 shows the top 20 Safeties from 2019 side by side with the top 20 under revised scoring
- Note an increase of 50-75 points (per season), bringing top Safeties to a scoring level in line with the top offensive scorers
- Also note the increase is most pronounced at the very top of the field (in keeping with one of the overall goals of the scoring revision - rewarding teams exponmentially for acquiring top players)
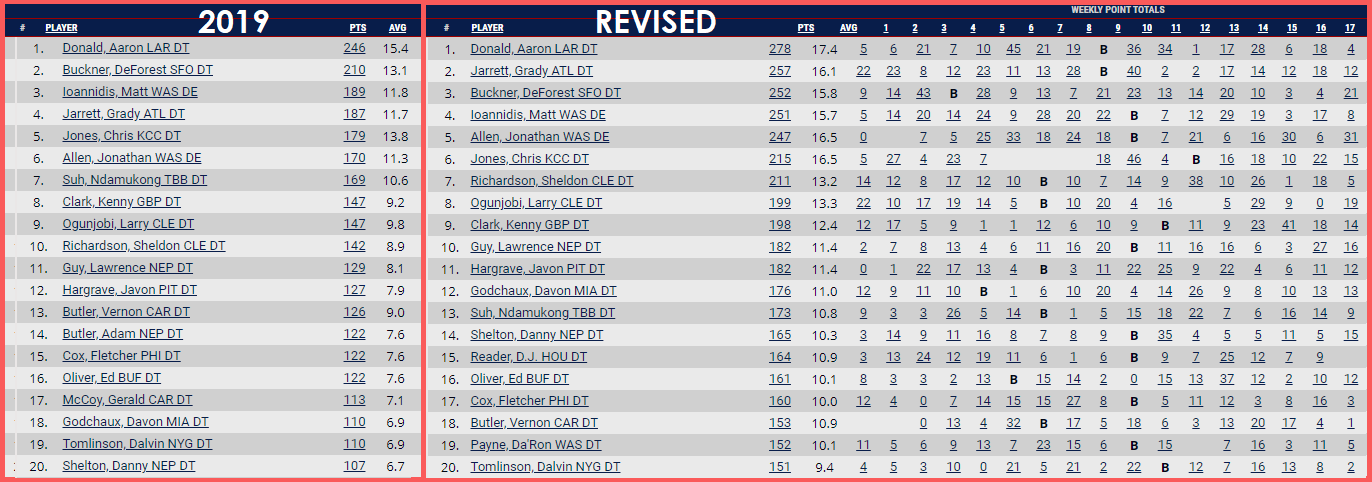
- Fig 9.2
- shows a side by side comparison at the Defensive Tackle position
- Note how the increased value expands the number of viable weekly starters at the position from 1 or 2 to +/- 10, increasing starting line-up options the same way revised Tight End Scoring did
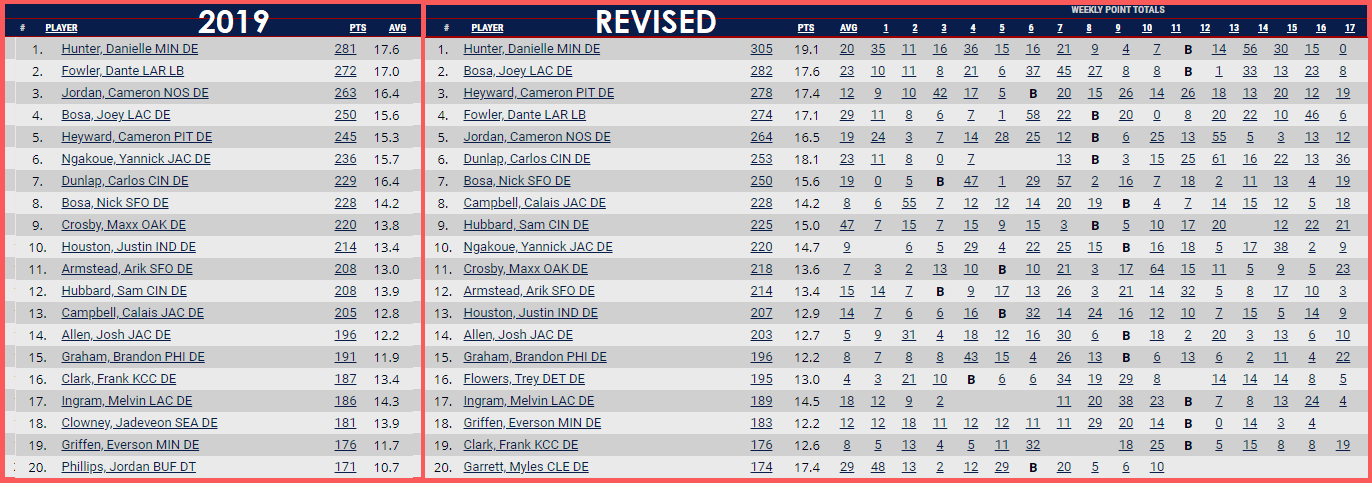
- Fig 9.3shows a side by side for the Defensive End position
- Note overall scoring is not too different from 2019 scoring but a look at the week to week scoring shows the potential for explosive individual game scores for disruptive pass rush performances
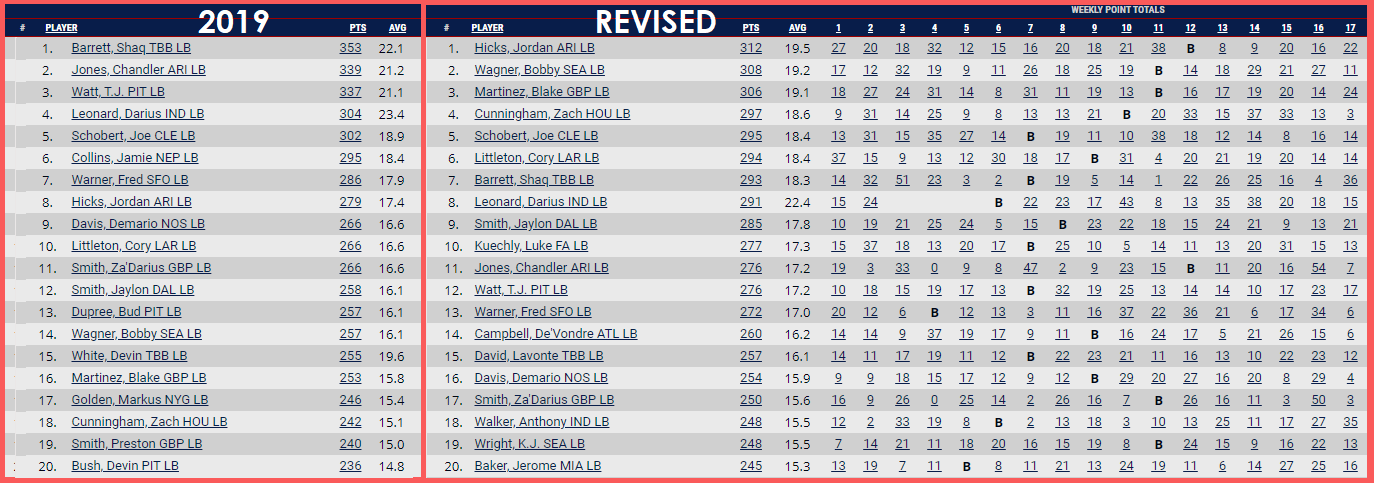
- Fig 9.4 shows a side by side of the top 20 at the Linebacker position
- Note that the very top end of Linebacker scoring actually drops from 2019 value, while the rest of the field increases in value
- This shows how the revised scoring rules have lessened the impact of exagerated scoring values (top end) while still increasing meat and potatoes scoring
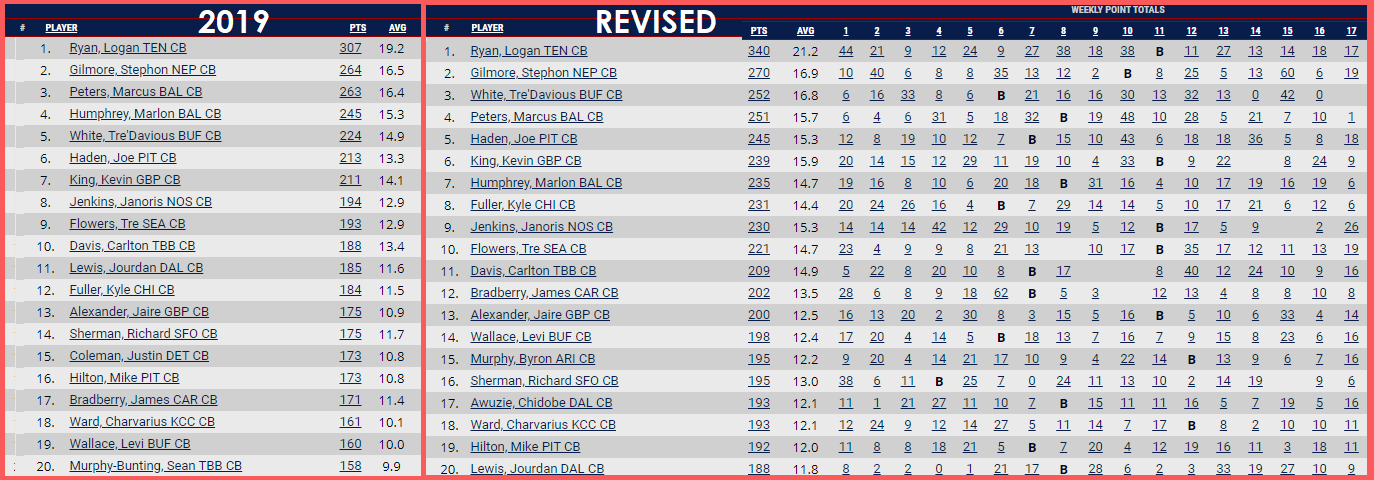
- Fig 9.5 shows a side by side for Cornerbacks
- Note results similar to Defensive Ends where week to week scoring shows cornerbacks with weekly lottery ticket potential for game performances with especially disruptive play in the defensive backfield
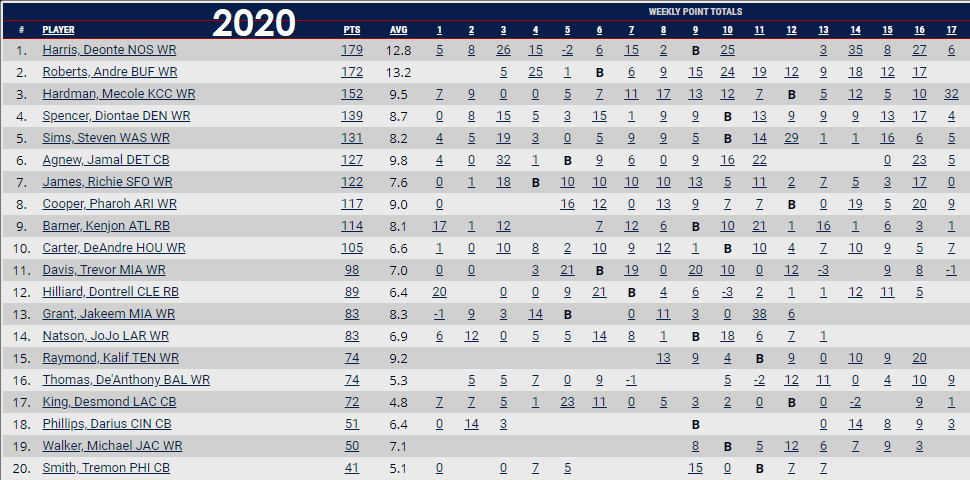
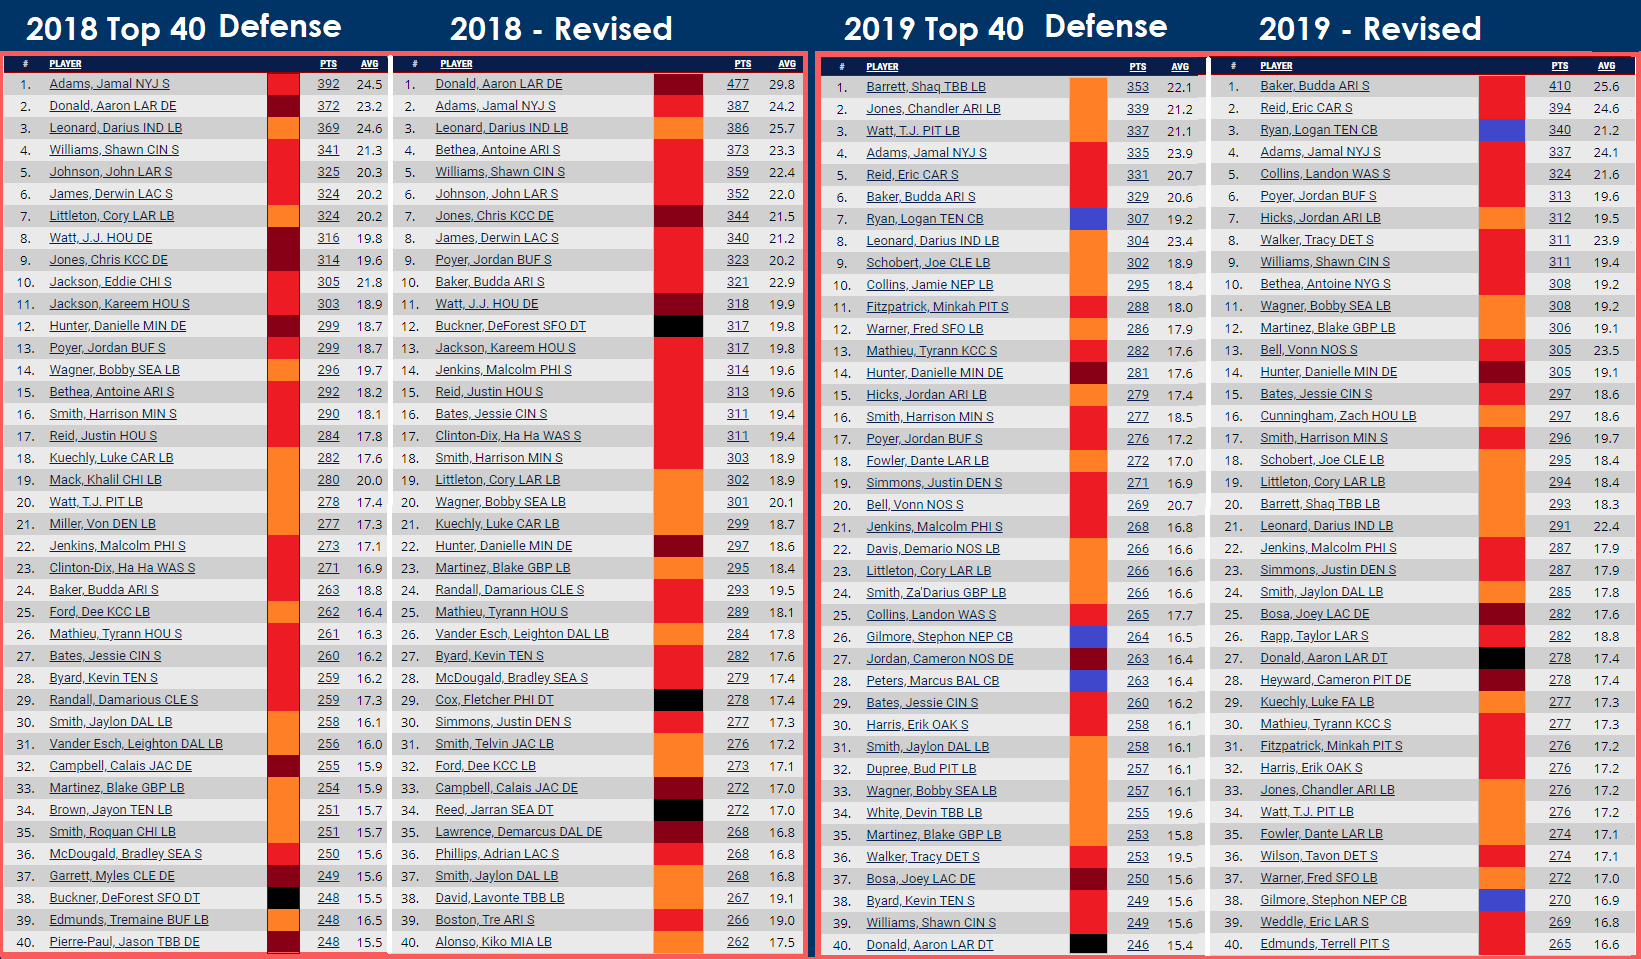
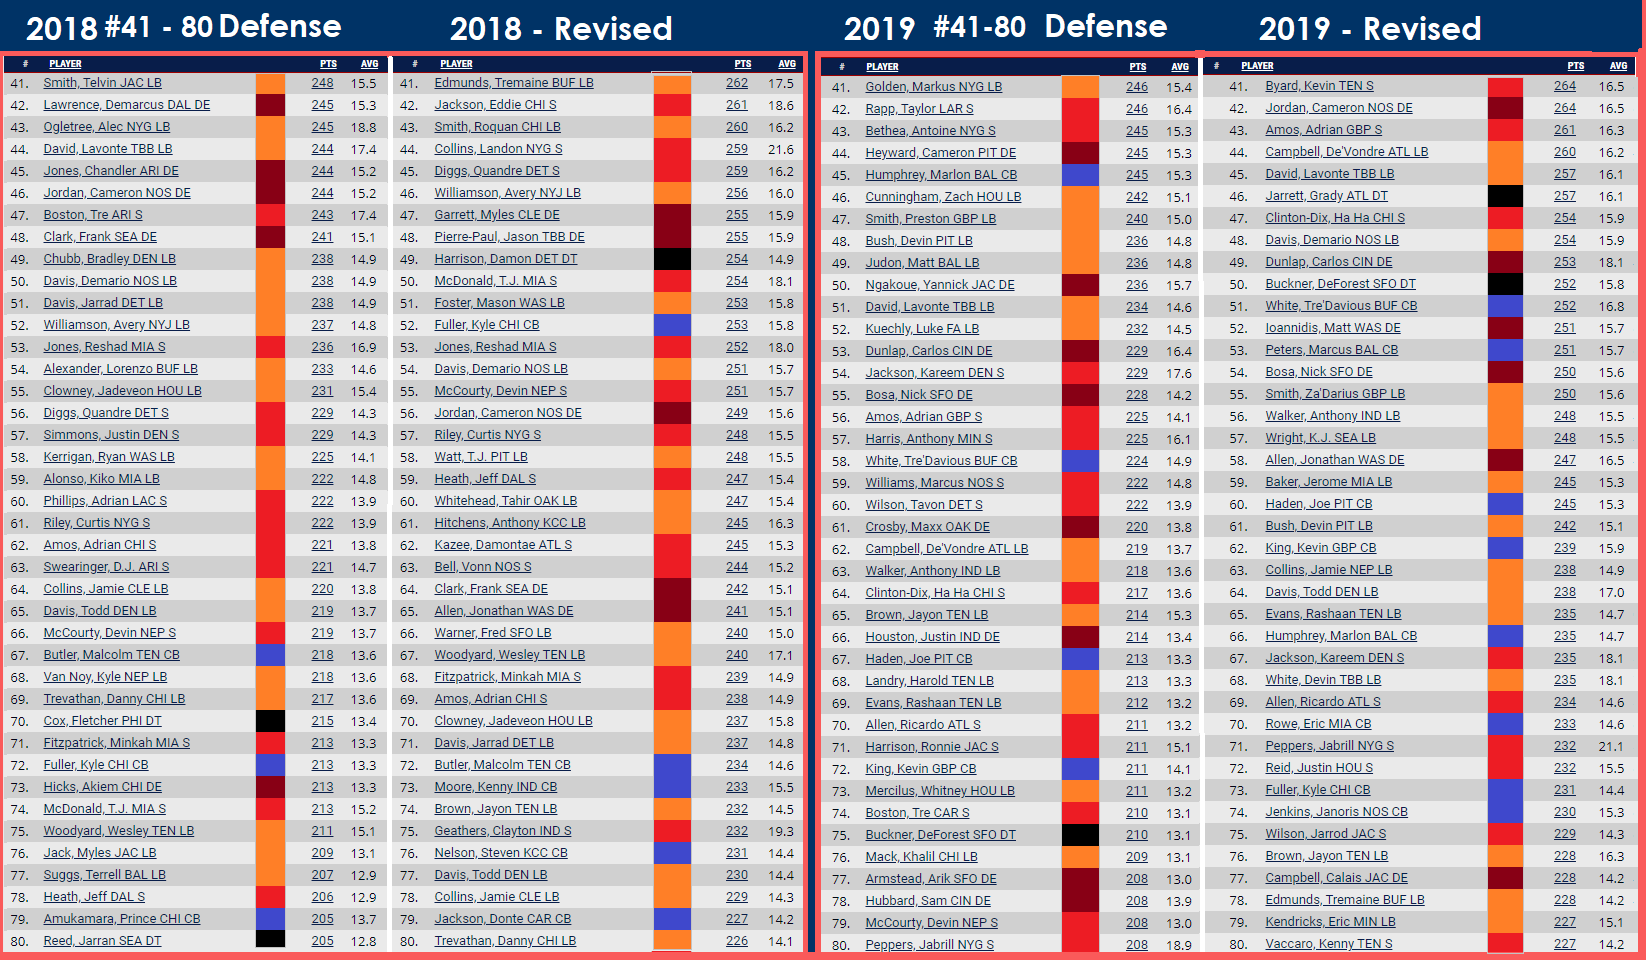
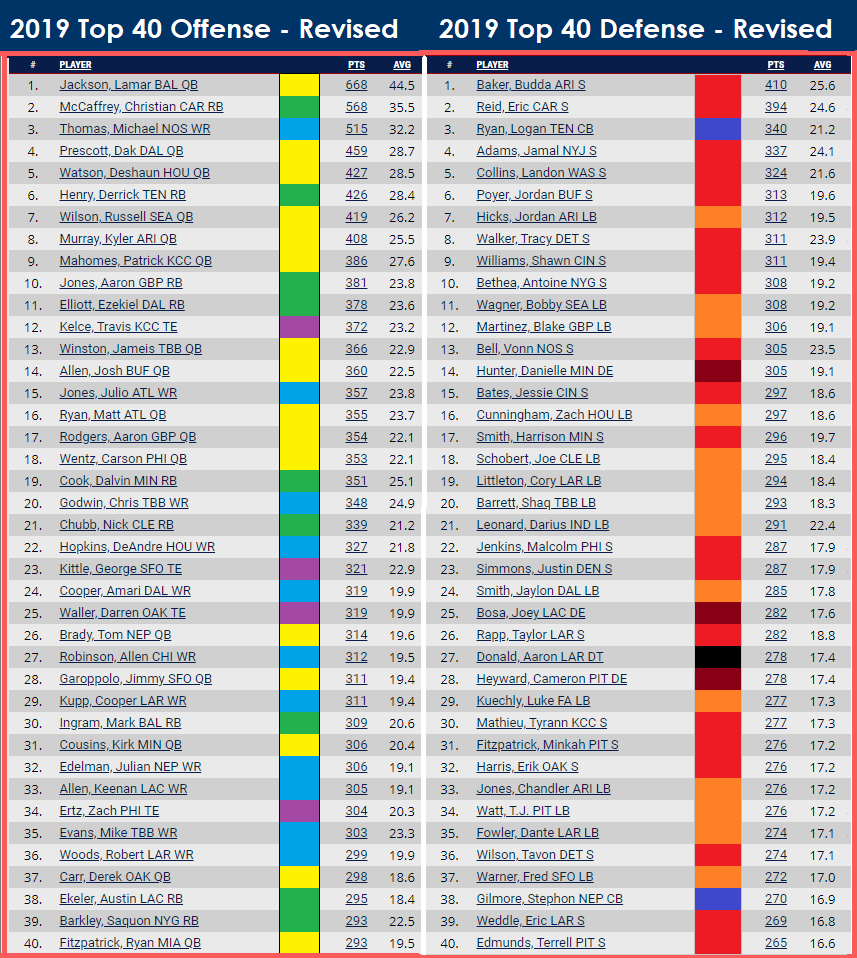
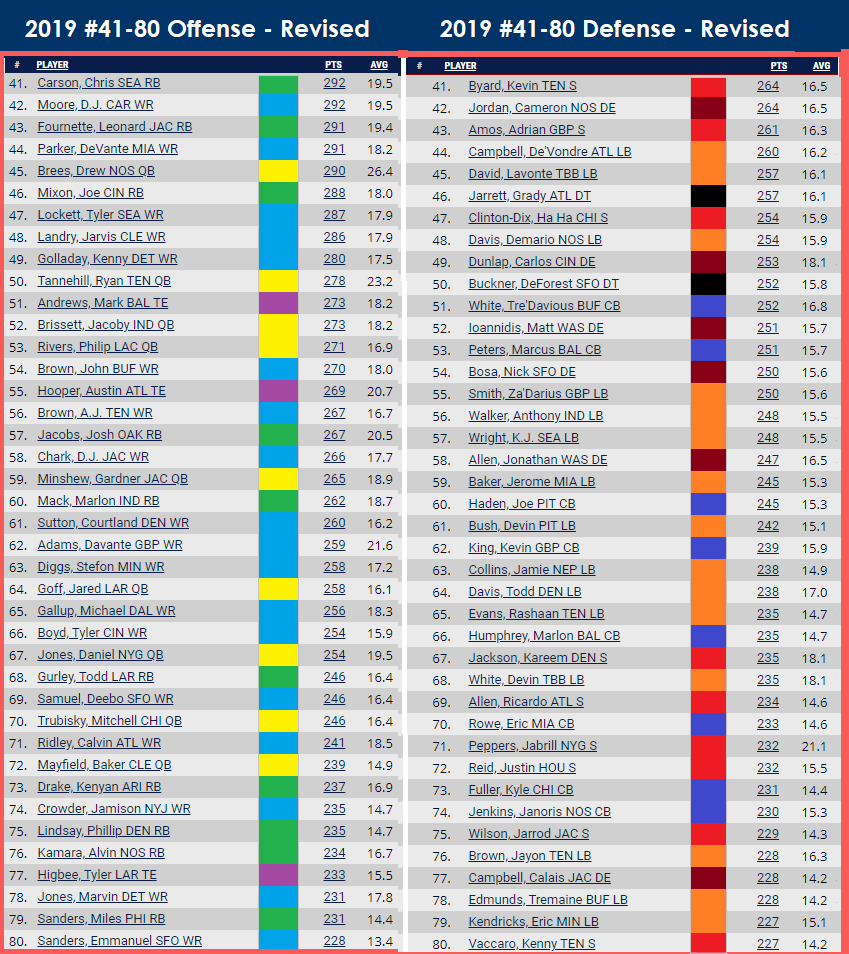
- Fig 9.6 and Fig 9.7 shows side by side comparisons of the Top 40 (Fig 9.6) and #41-80 (Fig 9.7) Defensive players under revised scoring as they compare to the final stats for both 2018 and 2019 by 2019 scoring rules, color coded by position for easier comparison
- Note in the top 40 (Fig 9.6) how the top safeties trend towards the top 20 of IDP's overall in both years, accomplishing the goal of valueing Safeties above other defensive positions
- Note also the greater diversity of position (in both seasons and in both top and bottom 40) between the old scoring rules and the revised set, providing both higher scoring and more varied options for IDP starters
Offensive-Defensive Parity / Summary
So this is where the rubber meets the road with the entire Scoring Revision Project. The ultimate goal for all of this has been to create scoring equality between offensive and defensive units.
METHODOLOGY:
So how do we tell if the scoring revisions have been successful?
- Using actual 2019 scoring totals, we can find Regular Season Per Game Scoring Averages for both offense and defense from last season - Regular Season Scoring Total (offense or defense) of all 20 teams added together then divided by 20 (teams) then divided again by 13 (weeks)
- Offensive Per Game Average = 92.33 points
- Defensive Per Game Average = 65.58 points
- We can also use midpoint between highest and lowest for those totals; this is called the mean and may be an even more accurate snapsot than overall averages are
- Offensive Per Game Mean Average = 92.85 points
- Defensive Per Game Mean Average = 60.92 points
- The only way to convert those averages to revised scoring totals would be to manually assemble offensive and defensive totals for all 130 Regular Season games and then sum and average them, so that puts an exact comparison out of reach
- BUT... with 5 offensive and 5 defensive starters on 20 teams (5x20), then theoretically, the starters could be viewed as the top 100 offensive players and the top 100 defensive players (5 each per team, distributed evenly)
- If each set of 100 (offense and defense) is divided into 5 groups of 20 players (1-20, 21-40, 41-60, 61-80, and 81-100), and then averages and mean averages are taken from each group, the results for 2019 scoring shows:
- Offense:
- Player #1: 30.85 per game average / 29.97 mean
- Player #2: 22.00 per game average / 22.22 mean
- Player #3: 17.40 per game average / 17.03 mean
- Player #4: 14.88 per game average / 14.84 mean
- Player #5: 12.87 per game average / 12.84 mean
- Theoretical Offensive Per Game Average (2019) = 98.00 / 96.90 mean
- Defense:
- Player #1: 18.79 per game average / 18.22 mean
- Player #2: 15.37 per game average / 16.13 mean
- Player #3: 14.64 per game / 14.69 mean
- Player#4: 13.26 per game / 13.19 mean
- PLayer #5: 12.61 per game / 12.69 mean
- Theoretical Defensive Per Game Average (2019) = 74.67 / 74.92 mean
- Offense:
- These theoretical averages compare favorably to the actual averages that we know (Offense - 92.33/98.00/96.90; Defense - 65.58/74.67/74.92) with both averages falling just 6 points and 9 points away from the actual numbers we know
- Therefore, we can assume that averaging scores in this way would be a good apples to apples comparison of the revised scoring
RESULTS:
- Using the methodology described above, and taking the 2019 stats and applying 2020 Revised Scoriong Rules, here are the reesults:
- Offense (REVISED):
- Player #1: 25.78 per game average / 23.72 mean
- Player #2: 19.32 per game average / 19.22 mean
- Player #3: 17.36 per game average / 17.06 mean
- Player #4: 15.25 per game average / 15.22 mean
- Player #5: 13.09 per game average / 12.94 mean
- Theoretical Offensive Per Game Average (Revised Scoring) = 90.80 / 88.16 mean
- Defense (REVISED)
- Player #1: 19.86 per game average / 19.25 mean
- Player #2: 17.35 per game average / 17.28 mean
- Player #3: 15.82 per game average / 15.75 mean
- Player #4: 13.84 per game average / 14.53 mean
- Player #5: 13.59 per game average / 13.62 mean
- Theoretical Defensive Per Game Average (Revised Scoring) = 80.46 / 80.43 mean
- Offense (REVISED):
- So using this methodology, the revised scoring brings the theoretical offensive/defensive squad averages to within 10 points of each other (per game) with an admitedly small sample size
- That compares to a 24 point per game difference for the exact same stats before scoring revisions and a 27 point differenc per game using the actual 2019 game results
- Using percentage comparison:
- In 2019 scoring by actual stats, defensive scoring was 29% lower than offensive scoring
- In 2019 scoring by theoretical average, defensive scoring was 24% lower than offensive scoring
- In 2019 scoring with revisions applied and using theoretical averages, defensive scoring is just 8% lower than offensive scoring
- Going even deeper beyond the top 100, if we break down the 101-150th ranked ofensive and defensive per game averages (by revised scoring) and take a mean average for every ten players we get:
- Offense: 14.15; 13.40; 12.50; 11.65; 10.75
- Defense: 13.35; 13.10; 12.90; 12.50; 12.20
- That would seem to indicate that offensive players lose value more quickly beyond the top 100 than defensive players; meaning there's more available depth for defensive positions, which makes sense
SAMPLES
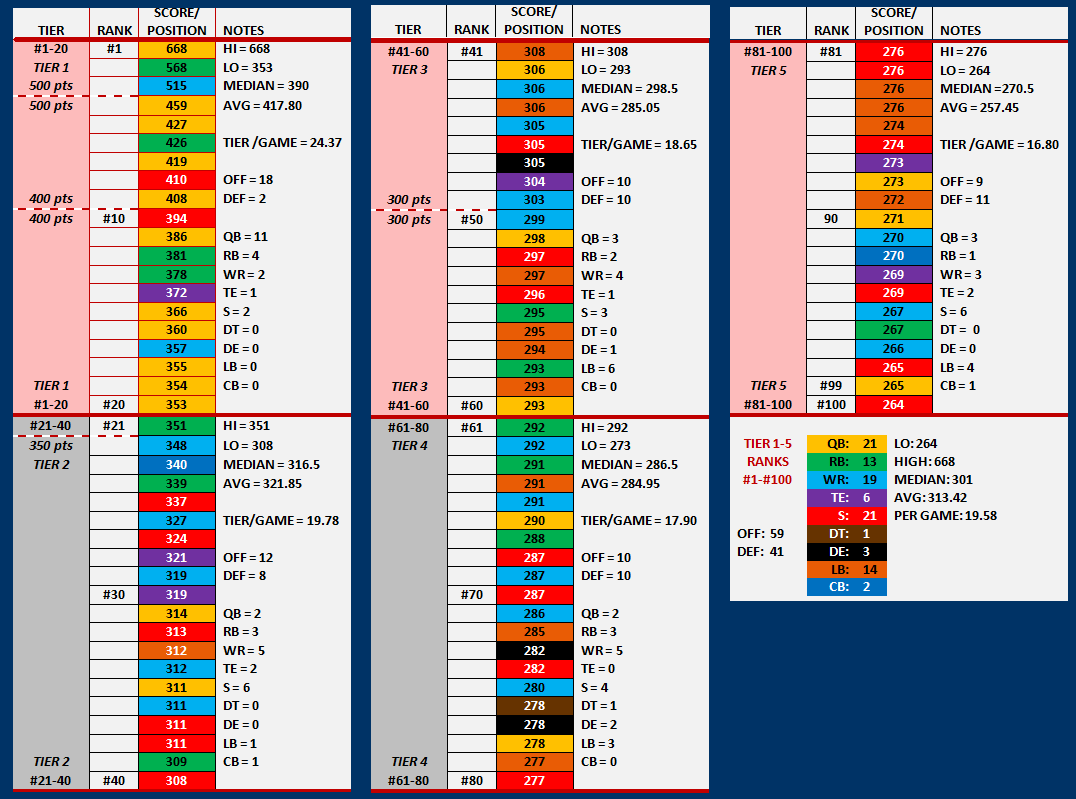
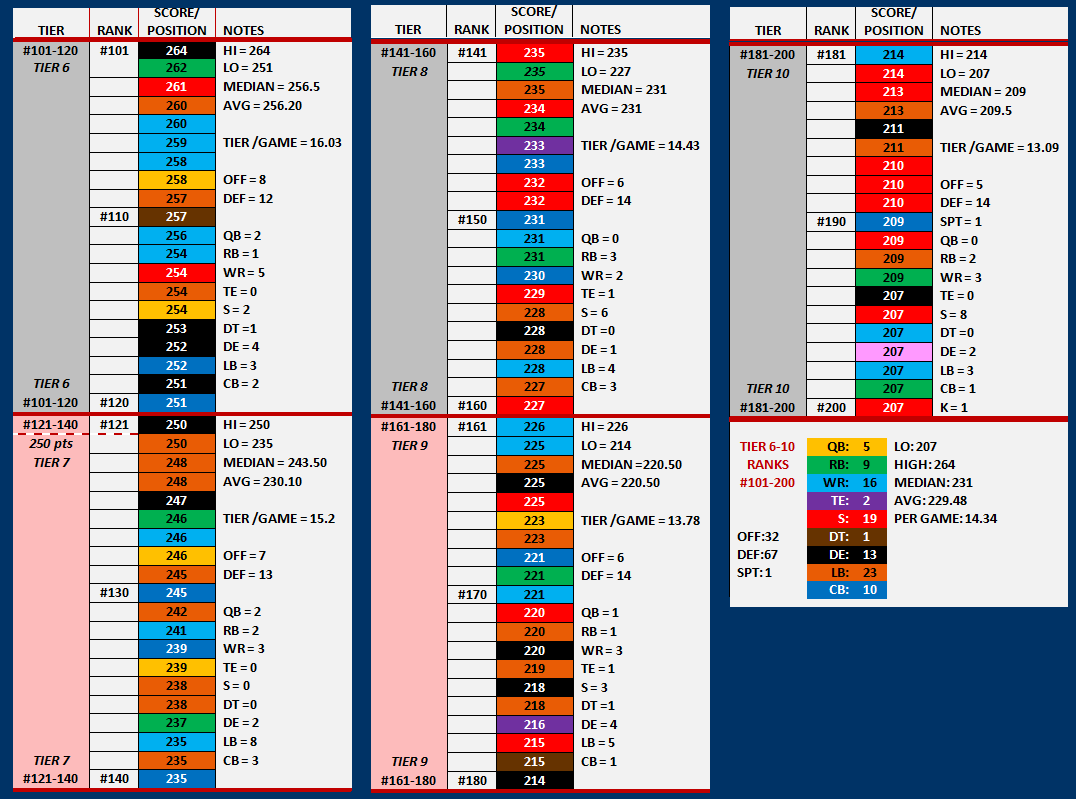
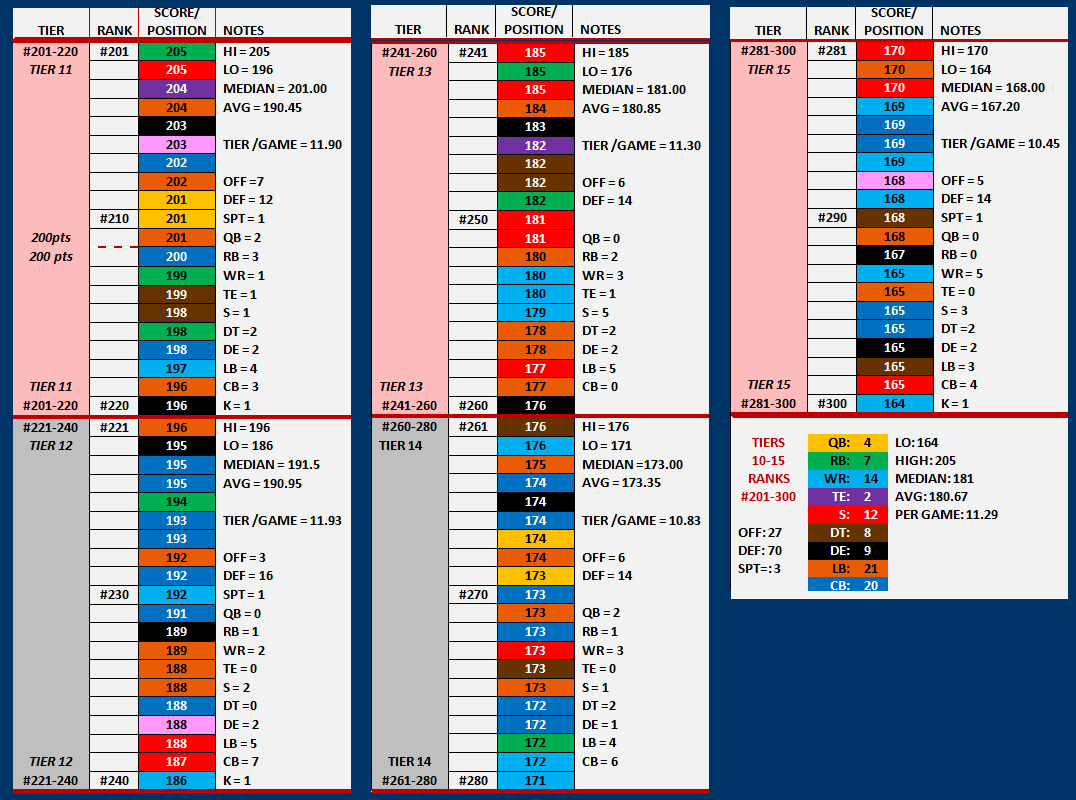
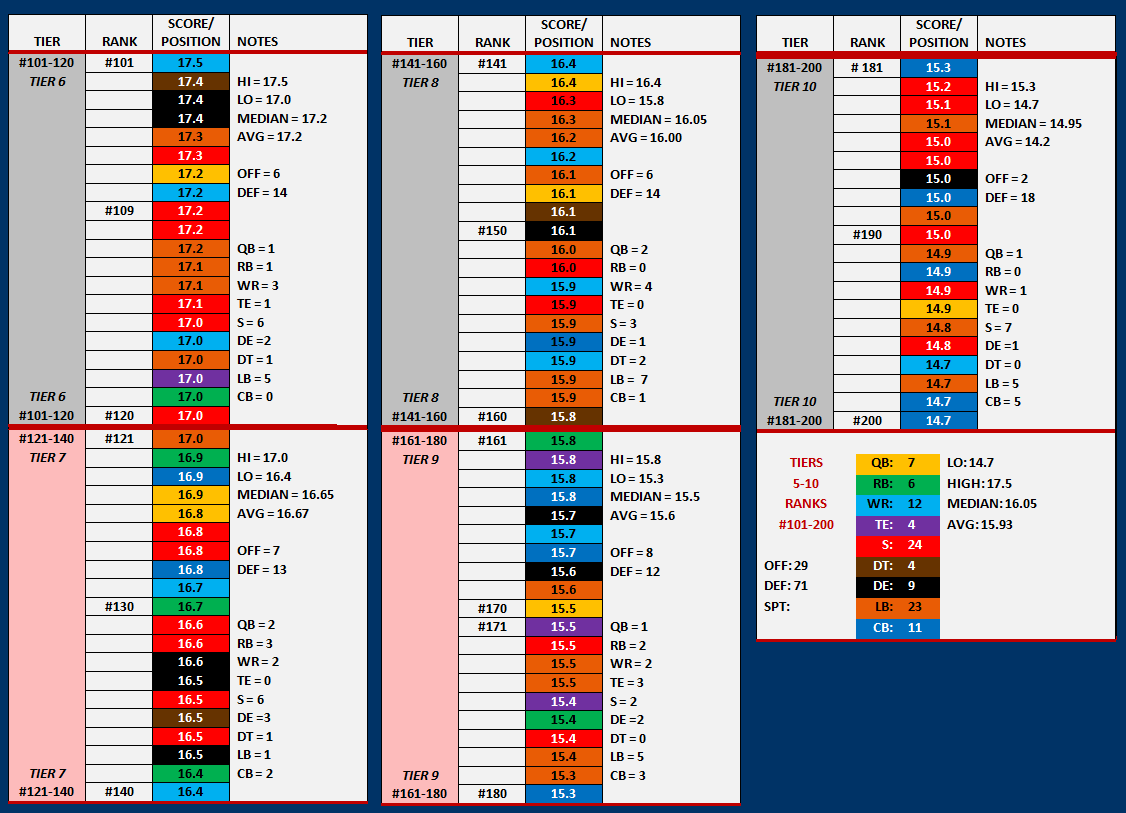
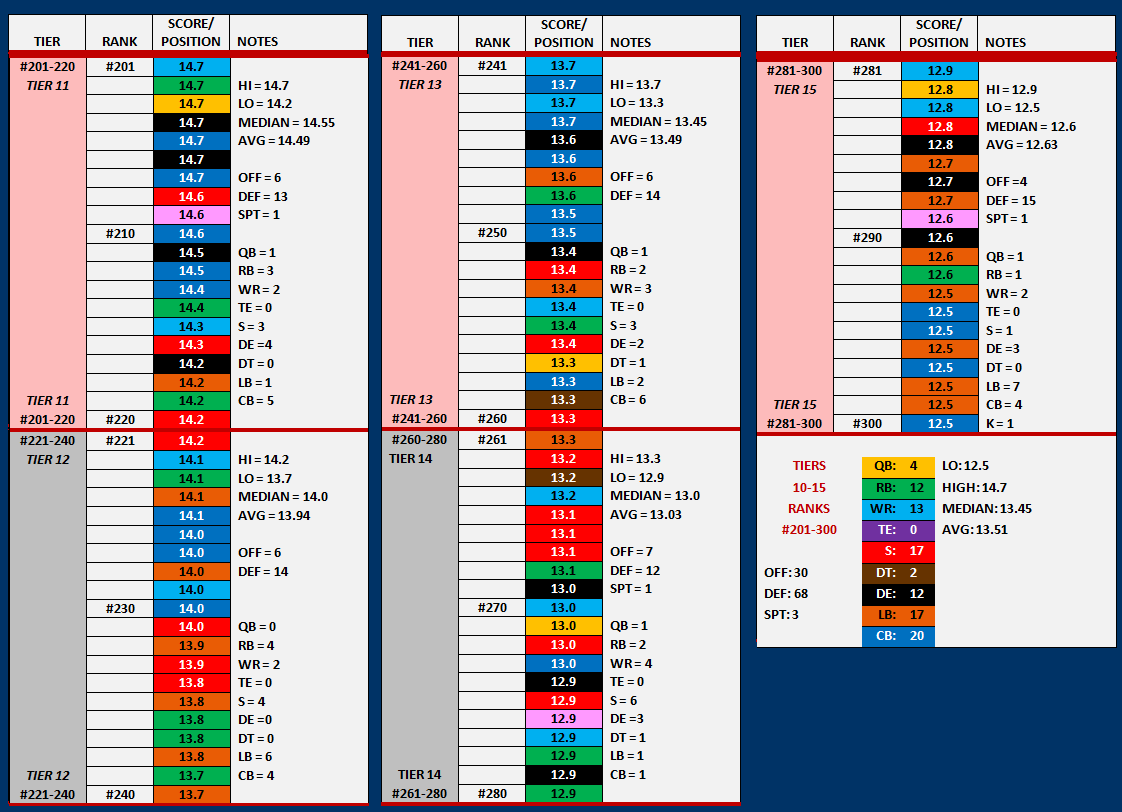
- Fig 10.1 #'s 1, 2, and 3 are all part of the same chart, broken down into 3 graphics because the chart is too large to view
- They show the Top 300 players' (overall, both offense and defense) by revised season scoring totals - 100 players per chart - broken down and color coded with player names removed so that the focus is just on the positions
- Note that the top 3 (a QB, a RB, and a WR) outscored the rest by a wide enough margin to throw the percentages for the top 20 offensive players off a bit
- Note also, that while offensive players dominate the top 20, the rest of the 20 player tiers are pretty equally distributed between offense and defense
- By the second and third hundred - charts #2 and #3 - defensive players begin to dominate, showing that depth mentioned above
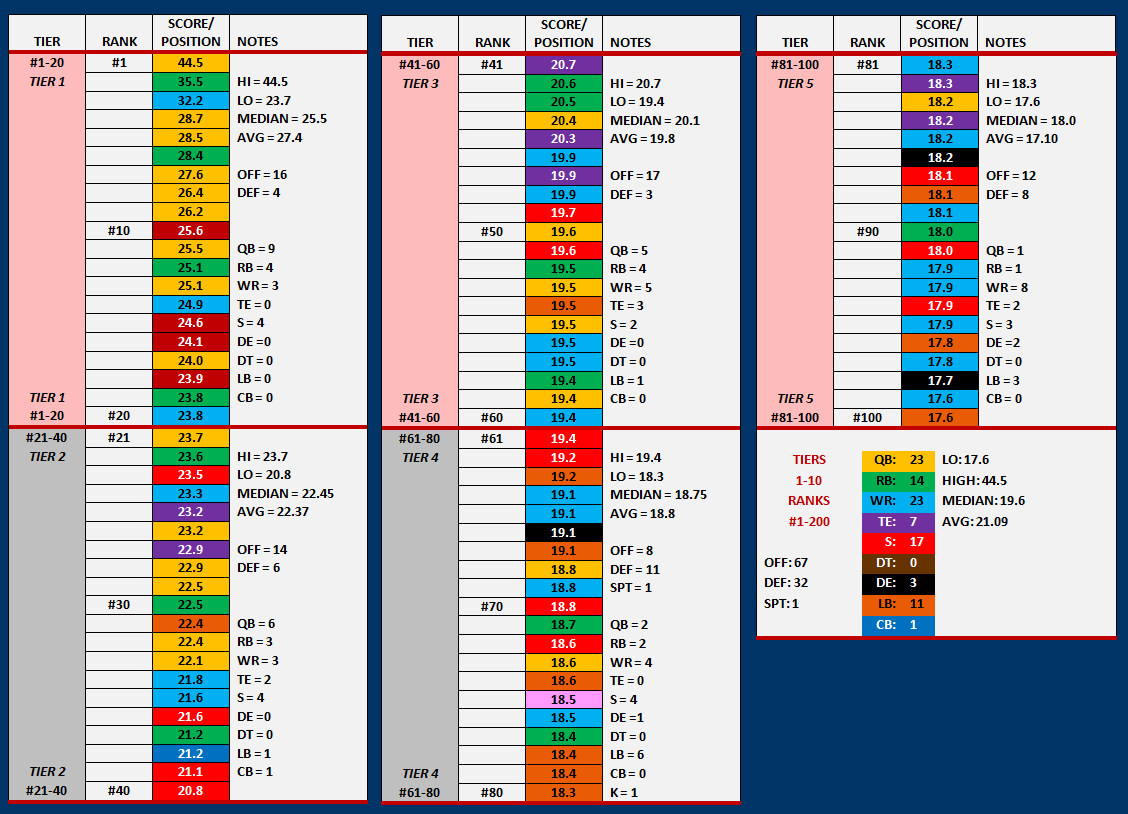
- Fig 10.2 #'s 1, 2, and 3 are also all part of the same chart, broken down into 3 graphics because the chart is too large to view
- They show the Top 300 players' (overall, both offense and defense) by revised per game averages
- Breaking it down and ranking by per game average is likely a much more accurate comparison - FOR EXAMPLE, because of his injury, Drew Brees ranks #66 by total scoring, but ranks #8 by per game average, and Brees is obviously more valuable than a #66 ranking
- Note that while offense actually appears even stronger than defense by the numbers of offensive vs defensive positions in each tier when compared to the Fig 10.1 charts, the per game averages from rank #10 all the way to #100 are all just within 7 points per game of each other, indicating that any player in that top 100 - offensive or defensive - has the potentioal to be more or less equal to each other on any given week
- Note also that in charts #2 and #3, defensive depth overtakes offensive, and the per game scoring remains incredibly close, with the #300th ranked player - a cornerback - averaging within 7 poiints per game of the 100th ranked player
- Fig 10.3 and Fig 10.4 are comparisons of the top 80 offensive and defensive players (revised scoring) side by side and color coded by position
- Note that on offense, quarterbacks are still important, but not nearly as much so as under previuous rules, and that after the top 20, there's a very good mix of offensive positions
- On Defense, the Safety position - by design - dominates the top 20 (to compete with quarterbacks) but by rank #40 (Fig 10.4) there's also a good mix of defensive positions
- Note also, that despite best efforts towards parity, offense still outscores defense through the top 80, BUT by the end of the second chart, you can see the levels of scoring start to even out and defensive position depth begins to take over
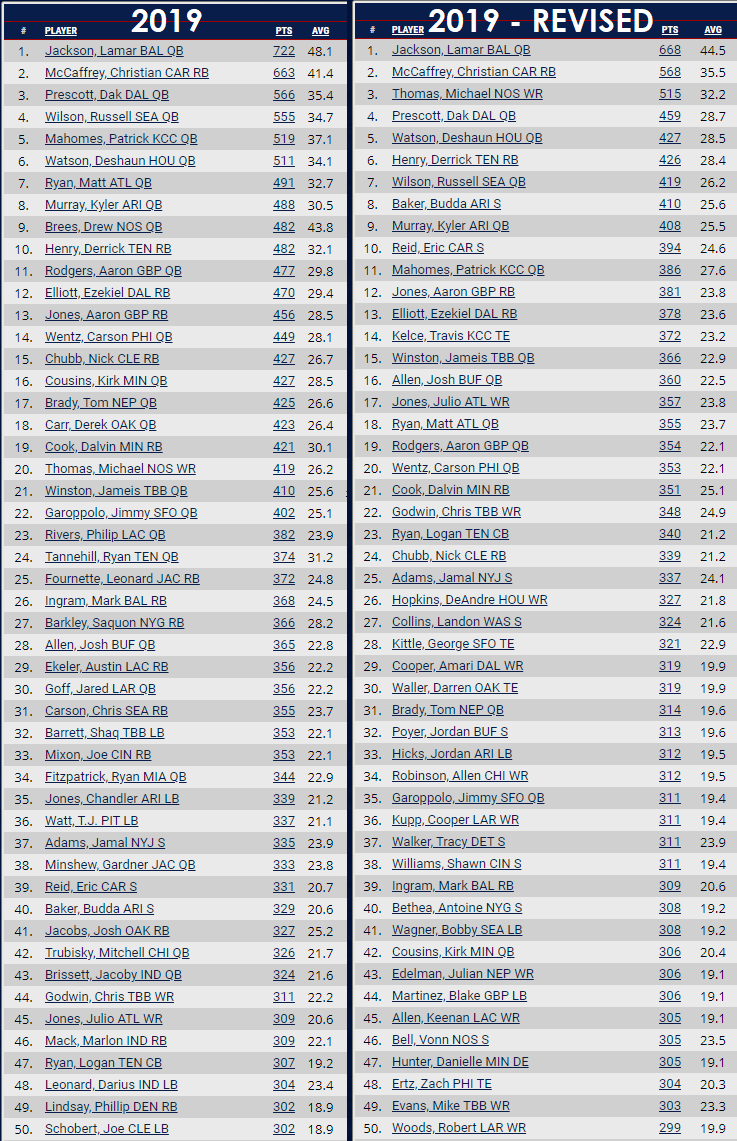
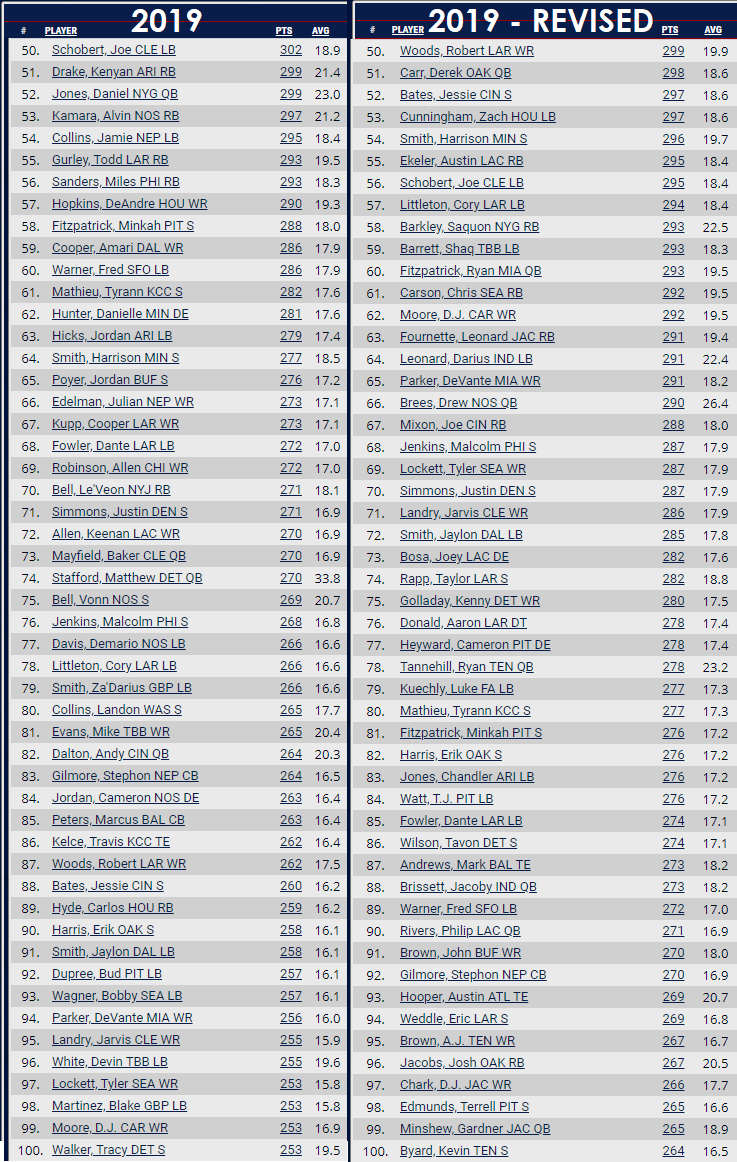
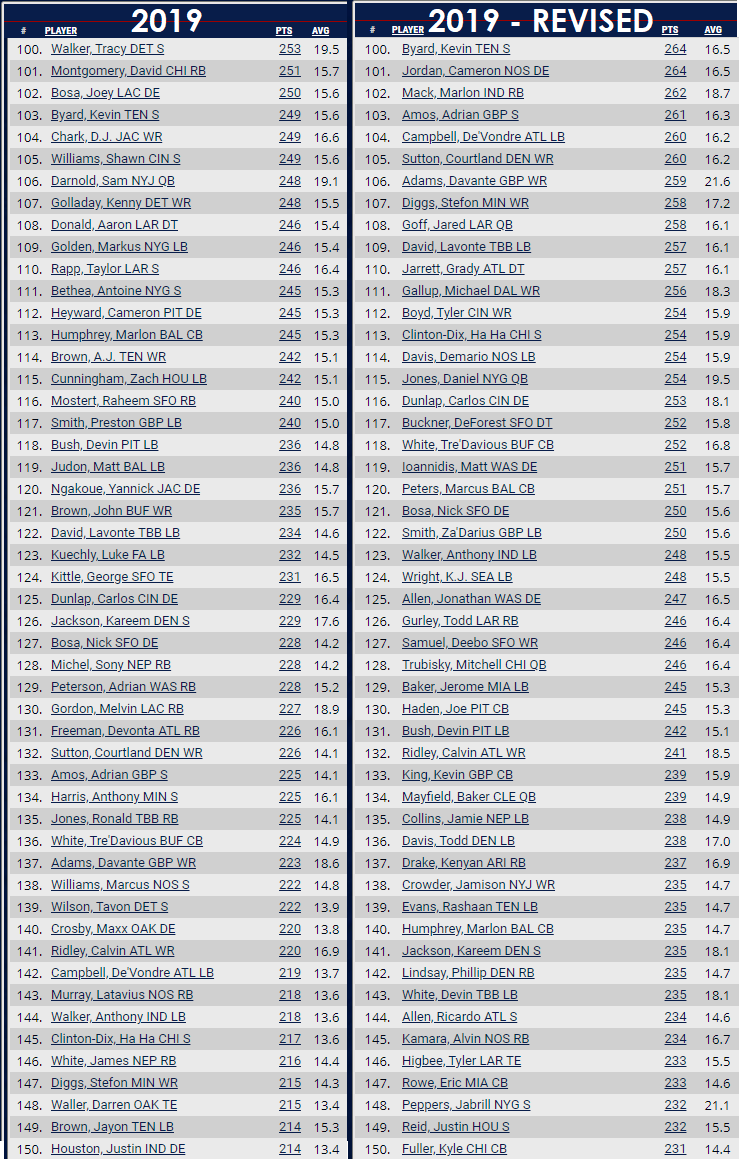
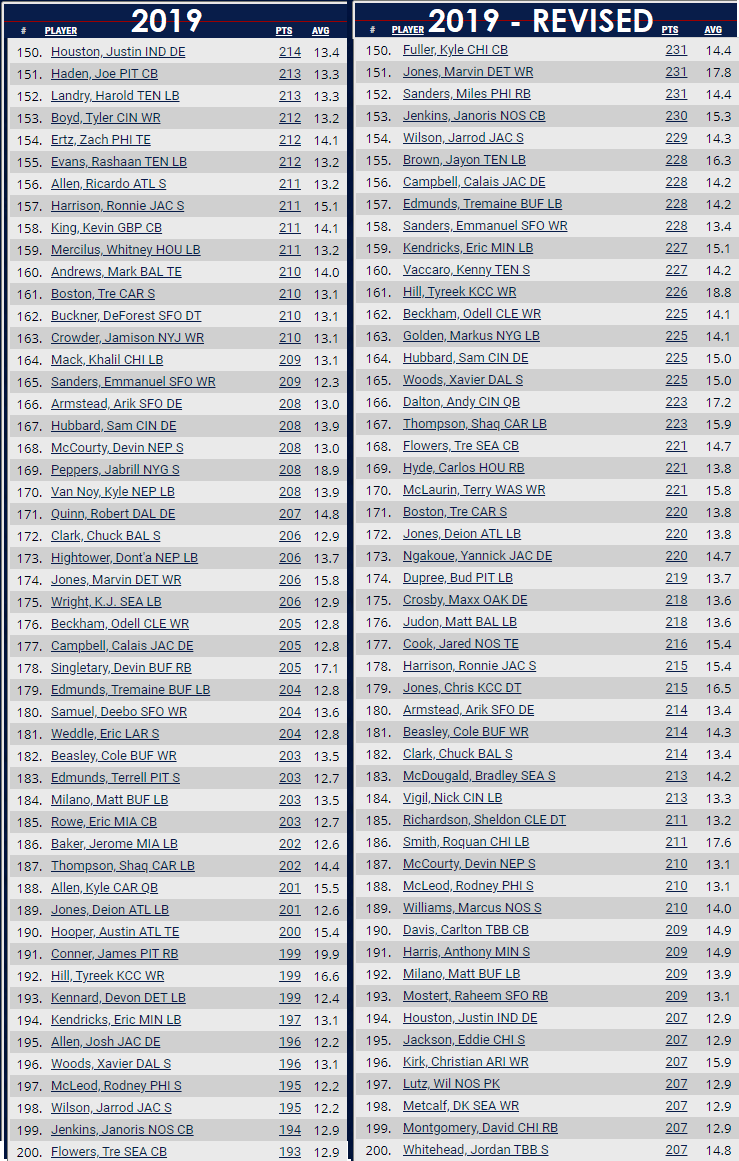
- Figs 10.5, 10.6, 10.7, and 10.8 show the top 200 - offense and defense combined - broken down into 4 groups of 50
- The headings are cut off, but the left side is 2019 scoring stats for offense and defense combined, and the right side is the 2019 stats for offense and defense combined with scoring revisions applied
- Like the other charts, it shows that offense still slightly outpaces defense, most notably in the top 50, but the side by side shows how much improved the parity is between the two from the 2019 numbers
CONCLUSIONS
Note from Crash:
Well here we are.....if you've made it through that entire report and arrived here, I'm very impressed. If you're reading this because you skipped right to the end, well that's ok too.
My plan was originally to only do about 10% of all that you see here, but by now, most of you have figured out just how obsessed I can get with this stuff. Being off of work for a month because of covid helped too.
I'm not going to rehash all of the comparisons, findings, and assumptions in the summary right above this section (if you don't go through the entire report, you should at least take a look at that section), but basically, I think these revisions have gotten offense and defense almost equal....not quite equal, but almost. The original idea was that - just like the NFL - you could win a championship with an average offense and a really great defense, and I think that the revisions now make that possible much more so than the original scoring rules did.
One goal I had for these revisions, however, I failed at because of my obsessive nature. I had set out to try to keep the revisions as simple as possible. Simple, they definitely are not. We're all going to need a cheat sheet on Sundays - especially for defensive scoring - for a while until we get used to them. On the other hand, though, this league was never intended to be a simple, casual fantasy football experience. I've always intended for it to be very immersive and complex, catering to a certain type of ff fanatic like myself. (Just wait, in another season or two, the plan is to introduce contracts to go along with salaries, and then I think things are going to start to get really interesting.)
There will also be some roster rules adjustments to go along with the scoring revisions - nothing major, just some adjustments to player maximums and bench size - and those will be released soon. Besides getting more parity between offense and defense, I think these revisions are going to do a whole lot for overall parity of all starting players. In other words, I think it will make the league much more competitive and challenging. And I think the revised rules for Kicker, Kick Returner, and the addition of a Punter position will make Special Teams just the right amount of a wild card factor to keep things interesting. Also keep in mind, that salaries are based on player scoring, so this parity of scoring is going to make things more competitive in the salary cap aspect of the game.
Lastly, I want to reassure all of you that this is not a sign that things are going to be overhauled to this degree every year. The League is still brand new and still finding itself. Part of the scoring issue stemmed from trying to use a modified version of pre-existing scoring rules instead of one designed 100% for this very specialized league. These revisions fix that. Unless this system falls completely flat on its face, I don't see the need for any other large-scale revisions to the scoring rules for years to come, and - as always - I hope that most of you reading this will still be here for years to come as well.
-Crash

